Un lien pour définir votre mot de passe a été envoyé à : Pour accéder à vos achats à l’avenir, vous aurez besoin d’un mot de passe.
Obtenez 10 images Stock avec un essai gratuit
Nouveaux filtres ajoutés
Trier par

19 155 résultats pour correlation dans tout

853 résultats dans les vidéos
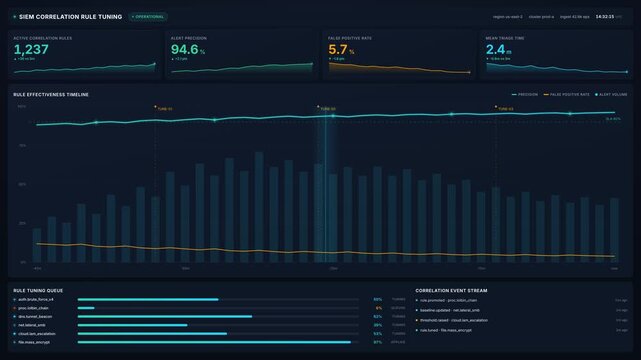
Security analyst reviewing 4k siem correlation rule tuning dashboard with live alert metrics, for cyber threat detection, data security, risk management
00:20
HD
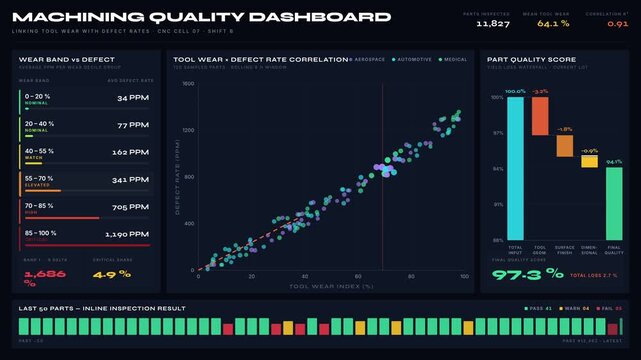
Analyze the Machining Quality Dashboard that links Tool Wear with Defect Rates using a dual-variable correlation chart and detailed data visualizations.
00:15
HD
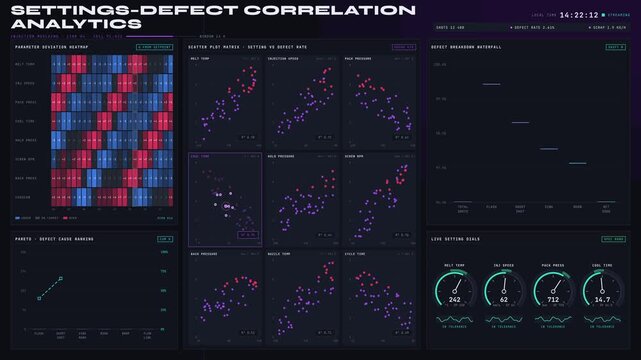
Explore the correlation between machine settings and defect rates in plastic production through a dynamic dashboard with various analytical charts and visualizations.
00:15
HD
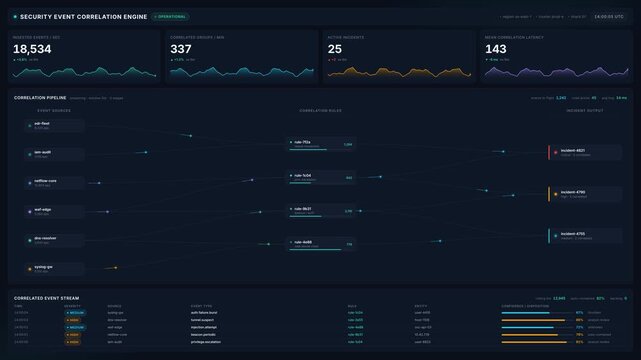
Security event correlation engine dashboard interface with live data streams incident alerts, for cyber threat monitoring, network security analysis, enterprise risk management
00:20
HD
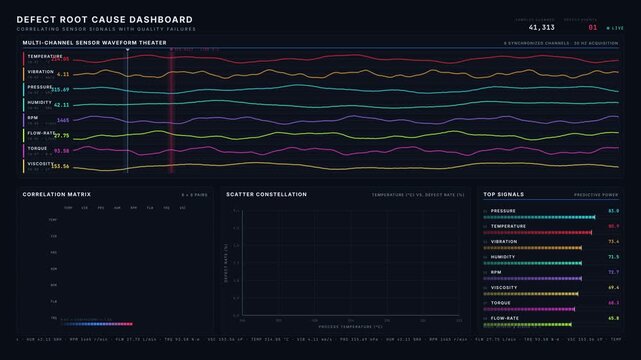
Explore a sophisticated defect root cause dashboard that correlates sensor signals with quality failures, showcasing dynamic waveforms and a correlation matrix in dark mode.
00:15
HD
Business growth concept in allusive graph chart showing marketing sales profit increasing to target . Excellent financial status of corporate business rise up.4k animation video graph
00:10
HD
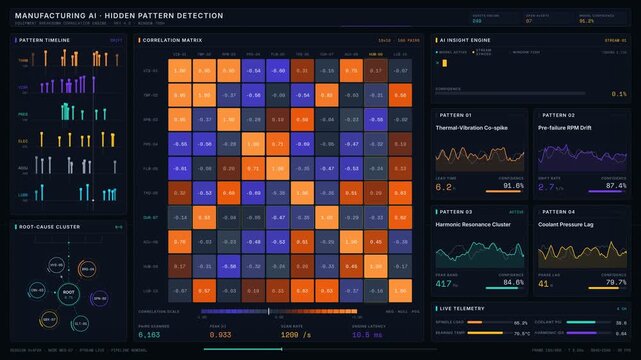
Explore a dark-mode manufacturing AI dashboard revealing hidden patterns behind equipment breakdowns with a dynamic correlation matrix and insightful data visualizations.
00:15
HD
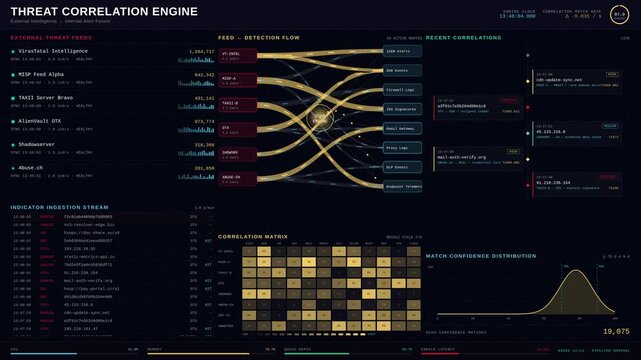
A sophisticated threat intelligence platform visualizes the correlation between external indicators and internal security alerts, showcasing live data analytics with vibrant colors and engaging.
00:15
HD
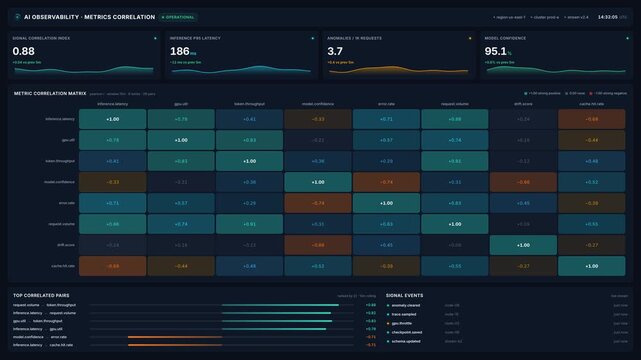
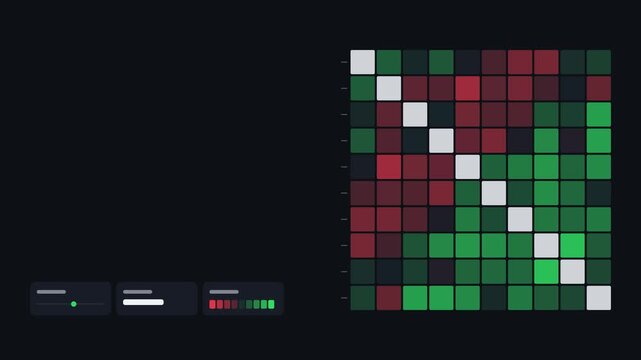
Ai observability dashboard with 4k animated metric correlation matrix heatmap, for real time performance monitoring, system reliability, data driven decision making for
00:20
HD
Intermarket correlation matrix links stocks yields and dollar
00:11
HD
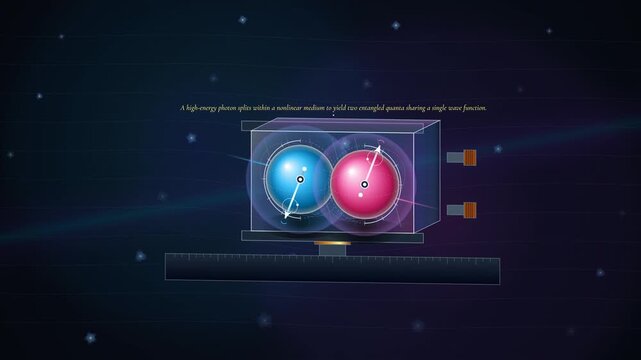
Educational animation visualizing the process of quantum entanglement, showing photon splitting, entangled quanta sharing a wave function, and nonlocal correlation across spatial separation
00:59
HD
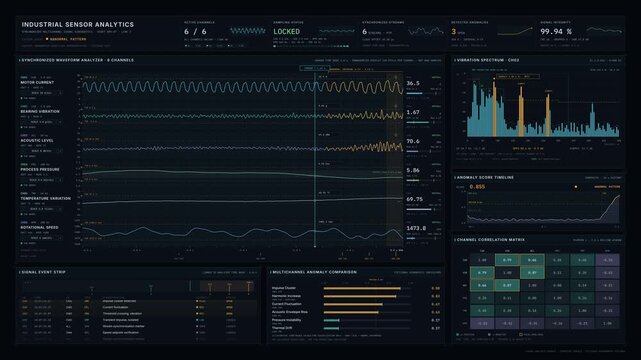
Premium industrial sensor analytics interface displaying synchronized multichannel waveforms, abnormal signal patterns, frequency spectra, and correlation matrices in a dark precision-instrument.
00:15
HD
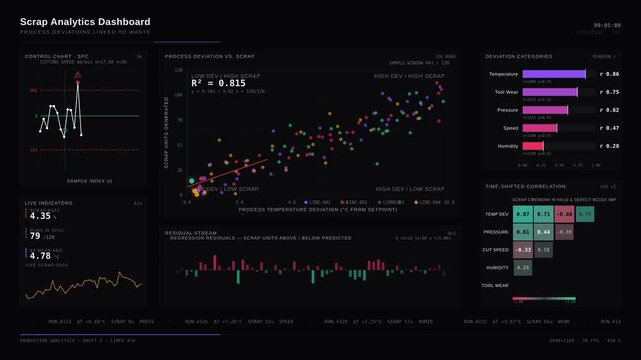
An advanced scrap analytics dashboard visualizing process deviations linked to waste through detailed scatter plots, control charts, and correlation matrices in vibrant colors.
00:15
HD
Animated correlation matrix of bubbles with alpha channel
00:10
HD
Negative correlation concept a cause and effect relationship where one element's increase leads to another's decrease. Impacting user ratings. Customer satisfaction
00:17
HD
Abstract bubble chart correlation glowing background seamless loop
00:10
HD
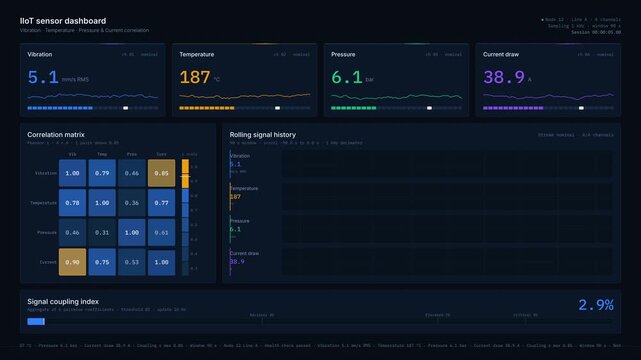
A dark-mode industrial IIoT sensor dashboard displays real-time data for vibration, temperature, pressure, and current correlation with animated visualizations and interactive elements.
00:15
HD
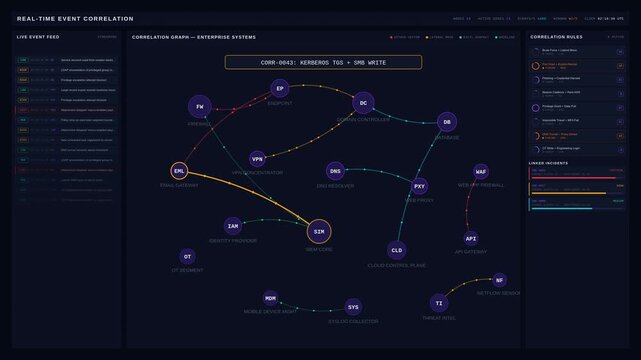
Cinematic 4K real-time event correlation dashboard showing suspicious activity connections across enterprise security systems with animated node graph.
00:15
HD
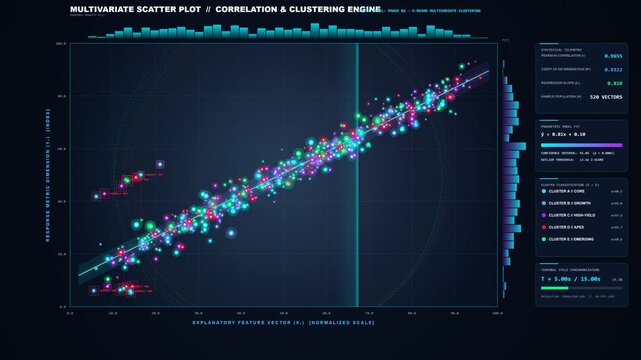
Multivariate scatter plot correlation and clustering engine analytical dashboard seamless loop animation
00:15
HD
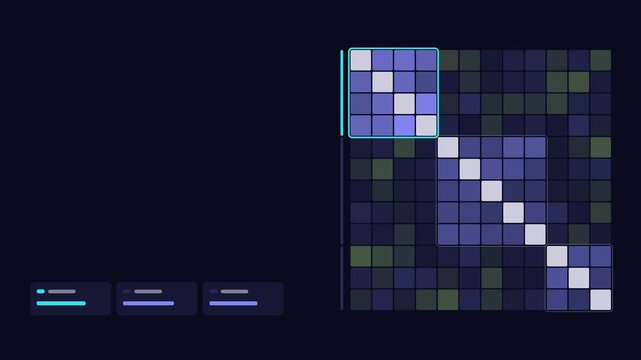
Seamless 4K looping finance animation: correlation matrix view wave update. Flat vector trading terminal with grid, axis ticks and blank readout cards in deep blue on a deep dark background, leaving c
00:07
HD
Negative correlation analysis a declining trend in data points from a scatter plot, impacting human interaction and health results, emphasizing risk and statistical research
00:17
HD
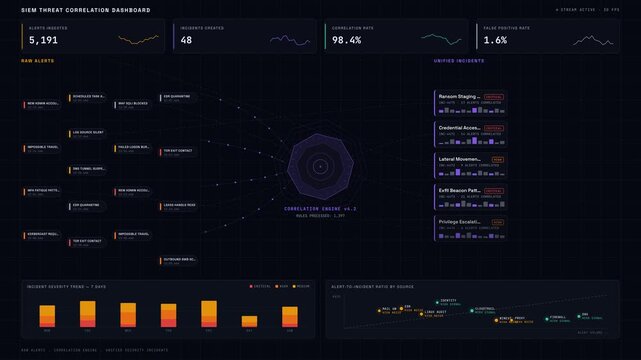
Experience a premium 4K dark-mode animation visualizing the SIEM threat correlation process, transforming raw alerts into unified security incidents with dynamic visual elements.
00:15
HD
Data analysis software, statistical tools, research presentations. Visual representation of interconnected data points with adjustable correlation threshold.
00:10
HD
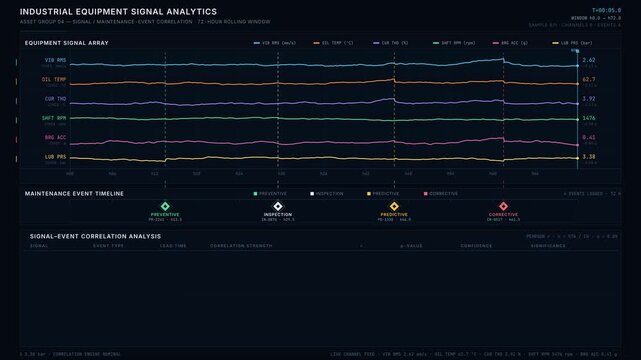
Industrial data dashboard showcasing correlated equipment signals and maintenance events with vibrant color-coded visualizations and analytical insights for effective monitoring.
00:15
HD
Seamless 4K looping finance animation: cluster correlation view highlighted blocks. Flat vector trading terminal with grid, axis ticks and blank readout cards in deep blue on a deep dark background, l
00:07
HD
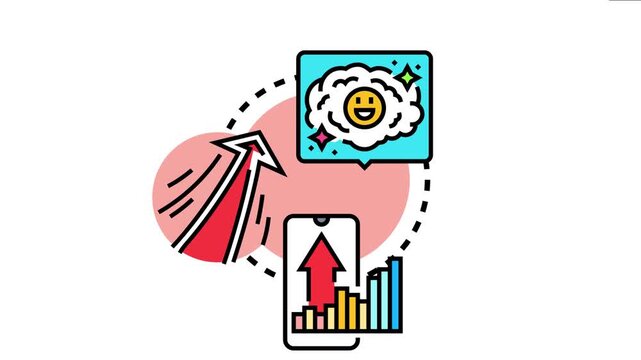
Visualizing positive correlation concepts with upward trends, smart phone data display, rising arrow, and a thought bubble showing a smiling face
00:17
HD
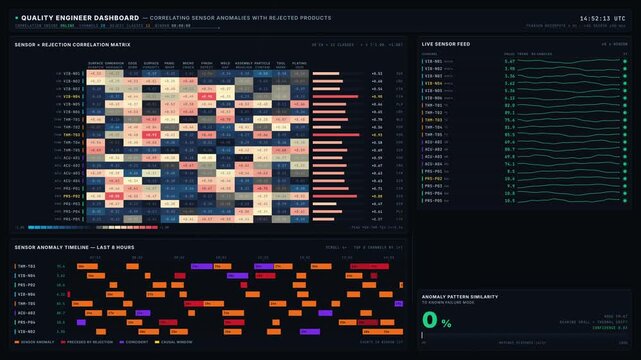
A quality engineer dashboard visually correlates sensor anomalies with rejected products using a heatmap and timeline, showcasing real-time data analysis and insights.
00:15
HD