Un lien pour définir votre mot de passe a été envoyé à : Pour accéder à vos achats à l’avenir, vous aurez besoin d’un mot de passe.
Obtenez 3 vidéos ou 25 images avec un essai gratuit
Nouveaux filtres ajoutés
Trier par

28 505 résultats pour fluctuation dans vidéos

Aucun résultat trouvé pour fructuation
Abstract digital bar chart visualizing data fluctuations on a dark background
00:10
HD
Abstract stock market digital display showing green and red financial data, trading indices and stock price fluctuation charts
00:10
HD
Real time crystal growth observed under polarized light microscope while changing polarization angle to reveal mineral anisotropic birefringence phase transformation and intense color fluctuations
00:20
HD
A dynamic financial chart displaying market fluctuations and economic decline trends on a digital display
00:10
HD
A young trader girl intently tracks real-time stock market fluctuations, her glasses reflecting the changing numbers on the screen, as she analyzes market trends with focus and precision
00:12
HD
Digital candlestick financial chart displaying market trend fluctuations
00:05
HD
Abstract Digital Audio Pulse Seamless Loop
00:15
HD
Abstract financial chart showing market growth and data fluctuations on dark blue background.
00:15
HD
Digital financial graph showing market fluctuations on dark blue
00:10
HD
Dedicated financial analyst reviewing rising market trends and stock fluctuations on multiple glowing digital screens within office animation video footage
00:05
HD
Dynamic digital data visualization displaying financial market fluctuations technology across a fu
00:10
HD
Red Stock Market Graph Animation Showing Economic Decline and Loss
00:25
HD
Dynamic background with water droplet particle convergence and explosion effects
00:10
HD
woman with bipolar disorder and contrasting happy and depressive shadows
00:10
HD
A visual representation of stock market data shows various price movements. The chart features colorful lines and fluctuations over time, indicating market trends and changes.
00:10
HD
Animated dotted line graph showing market trends and financial data fluctuations on dark animation 4k background
00:10
HD
A dedicated trader intently focuses on a mobile phone that shows various stock charts, intricately revealing fluctuations in market trends illuminated by vibrant and colorful digital displays
00:26
HD
Animated financial chart showing stock market data fluctuations with glowing lines and candlesticks. Seamless loop
00:15
HD
A digital financial line chart showing market fluctuations and stock performance trends.
00:08
HD
Dynamic red graph chart fluctuations moving on light background abstract motion background
00:10
HD
Technological light-sensitive particle special effects materials audio spectrum energy fluctuations
00:10
HD
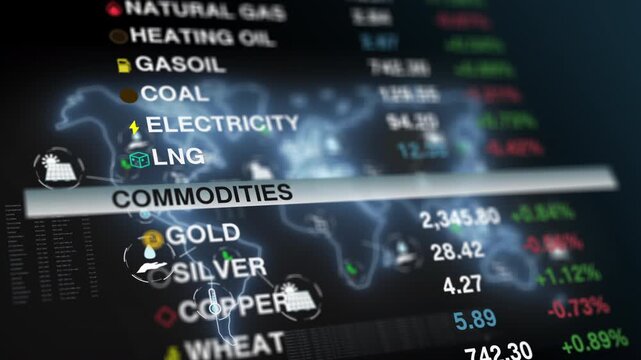
Animated style financial background combining global energy markets with world map visualization, price fluctuations and glowing indicators to represent worldwide trading activity.
00:06
HD
Glowing blue digital data wave chart showing business analytics fluctuations on a dark background
00:10
HD
Dark emerald green vertical lines motion background featuring deep forest color tones and rhythmic stripe patterns that animate with smooth light fluctuations for a professional cinematic video displa
00:10
HD
the process of carbon sequestration is displayed as an evolving gradient waveform chart showing numerical fluctuations within a dark digital interface during a data scan
00:06
HD
Animation of multiple charts visualizing the analysis of large amounts of data
00:14
HD
Abstract digital data stream with fluctuating financial stock market numbers and percentage indicators
00:10
HD
Digital candlestick stock market chart showing dynamic asset price fluctuations motion.
00:15
HD
Seamless looped abstract visualization of financial data, price fluctuations, investment analysis and trading activity. Financial market interface with changing charts. Forex trading concept
00:10
HD
Animated vertical bar graph showing data fluctuations
00:06
HD
Candlesticks indicating market crash on digital graph, suitable for finance or investment related design projects and presentations.
00:10
HD
Dynamic financial candlestick chart showing stock market price fluctuations and data analysis for investment, trading, and business concepts on a digital display with a shallow depth of field
00:09
HD
Digital visualization of inflation trends with glowing blue wave lines on a dark grid background representing economic market fluctuations and financial data analysis
00:10
HD
Financial Data Visualization: Dynamic representation of financial data, showcasing market trends and fluctuations with glowing lines and abstract bokeh, creating a sense of growth and analysis.
00:10
HD
A chart displays data trends with blue lines and yellow bars. The background is dark. The graph illustrates fluctuations in values over time.
00:10
HD
Stock market chart showing fluctuations in real-time.
00:36
HD
Modern sound wave visualizer animation with white frequency lines, and spectrum fluctuations on a green background for overlays and digital media projects in 4k
00:20
HD
Financial stock market trading chart with candlesticks moving across digital blue grid background showing data fluctuations
00:08
HD
Minimalist line graph animation showing data fluctuation and business growth trends on dark 4k background
00:10
HD
Imposter syndrome cycles between feeling fraudulent and brief confidence. Visualizing a pattern of imposter syndrome that swings between extremities: feeling fraudulent and brief confidence. Made by h
00:07
HD
Abstract blue vertical light waves motion background with smooth glowing tech pattern for digital design
00:30
HD
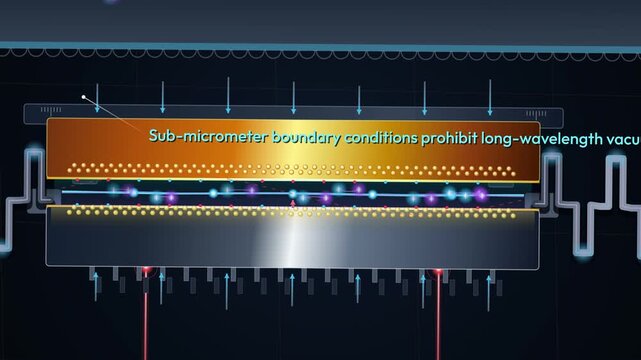
2D animation of a QED Casimir oscillator showing how sub-micrometer boundary conditions and atomically flat metallic surfaces interact with persistent zero-point fluctuations and vacuum modes
00:59
HD
Incandescent light bulb blinking and flickering in the dark. Close-up of a glass incandescent bulb with a reddish filament blinking and glowing in the dark, power fluctuations or malfunction
00:20
HD
Dynamic digital network illustrating financial market fluctuations with interconnected data points, visualizing upward and downward trends in economic analytics and technological progress
00:05
HD
Anomaly detection interface displaying changing grid heat maps with radar scanning cycles and digital drift index bars for tracking energetic fluctuations in a virtual workspace
00:06
HD
Animated financial charts displaying trading data move with the background
00:14
HD
Dynamic financial market analysis displays evolving candlestick chart with real-time data fluctuations and multiple analytical graphs motion graphics background.
00:20
HD
Business stock market trend analysis motion graphics animation with chart fluctuations and arrows
00:10
HD
Oil pump jack working at sunset with a dynamic stock market chart overlay showing financial trading fluctuations in energy sector economy representing global crude oil price changes and volatility.
00:10
HD
A digital stress assessment dashboard displays vital sign fluctuations and health metrics in real time through glowing graphic readouts across three distinct clinical monitor screen panels
00:06
HD
Animated financial chart with stock market data fluctuations
00:15
HD
Glowing financial chart with neon lines in digital style on dark background, concept of data analysis and market trends
00:10
HD
Neon purple digital bar charts showing data fluctuations
00:08
HD
Stock market candlestick charts showing financial trade fluctuations
00:10
HD
Lines and bars represent stock prices over time. Numbers indicate values while patterns show fluctuations in the market. This data is part of financial analysis.
00:10
HD
Abstract digital financial data visualization with stock market indices and cryptocurrency price fluctuations
00:20
HD
Financial candlestick chart showing stock market trading trends and investment growth fluctuations over time with motion graphics
00:10
HD
Detailed white audio waveform visualization showing varied amplitude peaks, rhythmic pulses, and frequency fluctuations across a minimalist black background.
00:10
HD
A digital dashboard monitors industrial heat management processes where thermal data fluctuations and efficiency metrics shift dynamically across a futuristic technical head up display interface.
00:06
HD
digital bar chart display showing monthly revenue fluctuations with glowing teal bars on dark interface background representing financial data analytics statistics and business growth tracking
00:06
HD
Hormonal cycle cycles between high hormones and low hormones. Visualizing a pattern of hormonal cycle that swings between extremities: high hormones and low hormones. Made by humans for humans.
00:07
HD
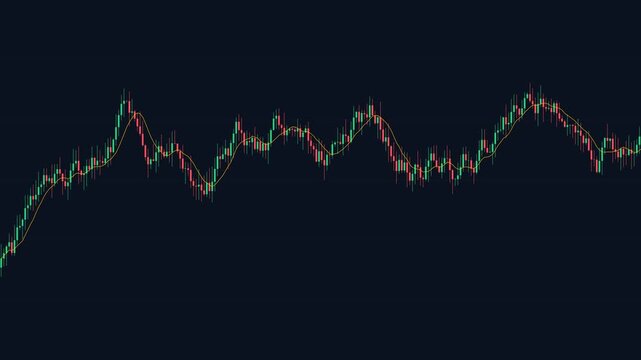
Financial stock market candlestick chart showing price fluctuations with a moving average line over time
00:13
HD
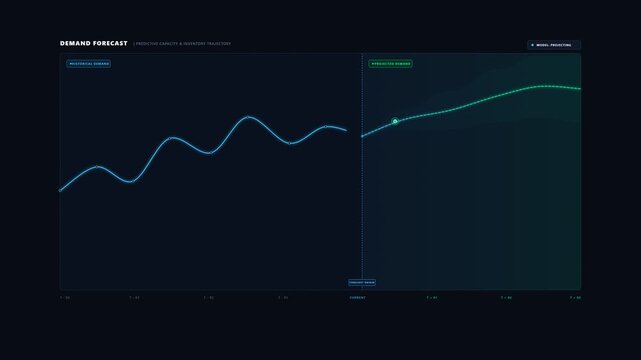
Animated demand forecast chart transitioning from historical demand fluctuations to projected future demand with a forecast range, illustrating demand planning, sales forecasting, inventory planning
00:10
HD
Volatile stock market trading animation with glowing orange price chart, financial trend analysis, investment risk, market fluctuation and digital fintech business background video
00:08
HD
Blue particle light effect dynamic background, blue particle fluctuation background
00:07
HD
Stream of animated graphs and charts processing different kinds of data
00:14
HD
Minimalist financial candlestick chart animation showing market fluctuations and trading data trends
00:07
HD
Financial candlestick chart showing market price fluctuations for
00:10
HD
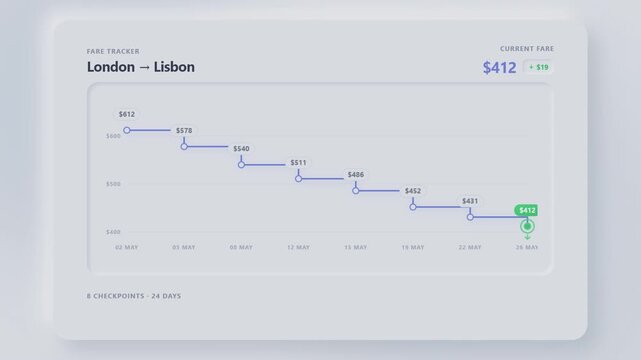
Digital fare tracker interface showing flight price fluctuations from London to Lisbon over time
00:07
HD
A digital vulnerability scanning dashboard interface displays rapid data fluctuations and server performance metrics during a routine security observation session on a glowing neon screen monitor
00:06
HD
Display of dynamic pricing software modules showing fluid data streams and numerical fluctuations in a digital interface dashboard featuring neon graphics on a dark crimson background
00:06
HD
Abstract digital wave visualization with glowing neon bars representing data fluctuations and financial market trends in a modern dark background
00:12
HD
Bar chart visualization illustrating market fluctuations and performance trends on a dark digital background data visualization financial trends
00:10
HD
Financial presentations, reports, and websites. Illustrates fluctuation of data over time, showing trends, peaks, and valleys clearly.
00:09
HD
Candlestick stock market chart animation showing financial data fluctuations and trading activity with green and red bars
00:08
HD
A digital interactive poll interface featuring adjustable sliders and shifting line charts shows data fluctuations for user input metrics on a dark glowing gradient grid surface
00:06
HD
immersive sonic technology graphic, animated tonal fluctuations and glowing frequency streams, futuristic music production concept, sophisticated recording interface, rhythmic digital motion. 4k
00:30
HD
Stock market fluctuations 3D animation for financial analysis
00:14
HD
Close-up of a colorful financial trading graph on a digital screen, displaying market fluctuations and economic trends. Perfect for illustrating investment, finance, and analytics concepts.
00:10
HD
Stock market trading chart animation with green and red candlesticks showing price movement fluctuation over time against a dark digital background for financial data analysis
00:10
HD
Spending habits cycles between frugal and extravagant. Visualizing a repeated pattern of spending habits that swings between extremities: frugal and extravagant.
00:06
HD
Audio waveform fluctuations in a digital display during sound analysis with cinematic motion
00:06
HD
Under neon glow stock exchange, bespectacled male broker hunches over his PC, scrutinizing flickering candlestick chart as price fluctuations surge. Nighttime focus sharpens his data-driven analysis
00:10
HD
A sophisticated digital interface displays a dynamic broadcast data overlay showing real time financial market fluctuations with glowing blue line graphs and professional statistical trading metrics
00:06
HD
Clear blue water surface material, clear blue water surface fluctuations
00:08
HD
Global stock market data showing financial trading fluctuations
00:20
HD
Digital finance dashboard tracking stock market fluctuations and economic trends, dark business interface with grainy texture 4k video
00:15
HD
Animated bar chart displaying financial data fluctuations and business growth statistics on a dark digital screen background, perfect for technology and corporate presentations.
00:10
HD
Stock market fluctuations animation, financial data trend, blue line graph, business growth visualization
00:06
HD
A digital shift scheduler interface displays dynamic fluctuations on a dark screen with vibrant neon metrics showing fluctuating cycles and various line graphs for modern systems
00:06
HD
digital financial dashboard showing colorful circular charts with cryptocurrency market price fluctuations displayed against dark tech-themed interface background with grid lines and data nodes
00:06
HD
Pipeline automation displayed on digital interface screens showing thermal loop cooling systems with rising numerical temperature data values and circular gauge fluctuations in a virtual environment
00:06
HD
Cryptocurrency market candlestick chart animation with real-time price fluctuations and digital data overlay
00:10
HD
Animated white line graph showing financial market fluctuations and changing stock price data values on dark blue grid background for digital business analysis presentations.
00:06
HD
Financial stock market trading chart displaying real time data fluctuations with glowing lines on dark digital interface
00:07
HD
Stream commerce interfaces display evolving digital metrics in a vibrant neon aesthetic that showcases fluid data fluctuations across multiple mobile device screens set in darkness
00:06
HD
dynamic voice signal display animated frequency fluctuations glowing waveform trails podcast recording concept contemporary audio interface smooth digital movement, cinematic black. 4k
00:15
HD
Blue stock market candlestick chart with financial data and blurred background . Concept Stock Market Trends, Financial Data Analysis, Business Investment, Candlestick Charts, Market Volatility
00:04
HD
A stream of small air bubbles rising from the depths.
00:10
HD
Financial graph showing statistics, prices falling, stock market crash, crisis, inflation rate. Electronic chart with stock market fluctuations abstract concept.
00:59
HD