Un lien pour définir votre mot de passe a été envoyé à : Pour accéder à vos achats à l’avenir, vous aurez besoin d’un mot de passe.
Obtenez 3 vidéos ou 25 images avec un essai gratuit
Nouveaux filtres ajoutés
Trier par

13 054 résultats pour decrease arrow dans vidéos

Speedometer icon animation with green circular gauge. Speedometer icon data monitoring. Speedometer icon interface graphic on black.
00:12
HD
Business decline bar chart animation with falling line graph and shadow effects on transparent background. Indicate revenue decline, financial loss, negative growth
00:06
HD
Financial professional assisting clients in minimizing currency exchange costs, symbolizing cheaper international money transfers and optimizing transaction strategies for better value
00:17
HD
Glowing graph with upward arrow labeled "QUALITY" and downward arrow labeled "COST" on a dark background. Symbol of business strategy, pricing, production, efficiency, and trade-off between quality
00:10
HD
Abstract neon business graph.business decrease Bar chart growth analysis with upward trend projection sand market trends.
00:10
HD
Fire danger level indicator scale. Low normal & high meter infographic animation on black background. Showing high fire danger level color gauge indicator for safety and risk monitoring.
00:10
HD
Bahamas Crude Oil Price Decline with Oil Barrels and Downward Green Arrow
00:11
HD
Flat Design Infographic Illustrating Birth Rate Decline Using Descending Bar Chart and Colorful Baby Symbols,with Downward Arrow.  Demographics, Population Change, Fertility Statistics
00:05
HD
Collaborative Effort to Solve Housing Market Challenges with Puzzle Pieces and Graph Indicators of Declining Trends in Real Estate Sigmoid
00:15
HD
Neon line CO2 atmosphere build-up, climate change CO2 reduction needed concept. Alpha included CO2 Emission Reduction Cloud Icon with Arrows and Label
00:10
HD
life expectancy level indicator scale. Low normal & high meter infographic animation. Showing high life expectancy level color gauge indicator. on a black background 4k animation video
00:10
HD
Downward moving animated curved arrow in violet colour
00:15
HD
A simple animated bold red downward arrow icon on a vibrant green screen, indicating download or drop.
00:12
HD
Hand gesture shows cost reduction. Person in blue shirt over wooden table. Arrow points down with cost percent text. Ideal for financial presentations
00:05
HD
Abstract increase icon on green background. Dollar rate up looped icon. Reduce costs sign and symbol. 4k video animation
00:10
HD
A yellow neon outline depicts a gear puzzle pieces a bar graph and a downward arrow against a black backdrop
00:08
HD
3D Business Statistics Bar Chart with Downward Arrow Showing Financial Decline, Falling Revenue, Market Loss and Negative Growth Data Visualization on Green Screen
00:05
HD
White chalk down arrow doodle on textured green background
00:08
HD
Gambia Oil Price Falling with Oil Barrels Downward Green Arrow and 3D Financial Data Visualization Graphs for Economy and Business Concept
00:11
HD
Hippiness Meter Animation.Measuring Hippiness from Low to High Levels.Increasing and Decreasing Gauge from low to high Levels, Comparison Indicator for  perfomance,Data Visualization
00:10
HD
Three Dimensional Green Arrows Forming A Universal Triangle Loop Symbol Representing Ecological Responsibility Sustainability Efforts Waste Reduction Awareness And Circular Economy Initiatives
00:08
HD
Engine rpm speed meter Performance speedometer concept Loop animation with Alpha Channel
00:10
HD
99 Percent Business Loss Counter Animation from 0 to -99 with Down Arrow Indicator in 4K, Negative Growth, Financial Decline, Revenue Drop and Market Performance Motion Graphic, -99% on Transparent
00:07
HD
Gold Euro Coin Value Decrease Down Arrow Animation on Navy Blue Background for European Finance Crash
00:12
HD
Arrow pointing downwards showing Stock market crisis. Stock market crash.Stock market decline. Financial crisis. Arrow of decreasing economy on the graph.
00:10
HD
Carbon dioxide indicator scale. Low Normal High meter infographic animation on black background. Showing high carbon dioxide level color gauge indicator for air quality and environmental monitoring.
00:10
HD
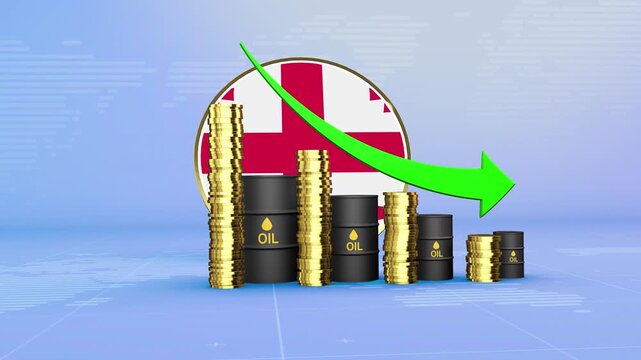
Georgia Oil Prices Decline with Oil Barrels, Gold Coins and Downward Green Arrow, 3D Economic and Financial Market Concept
00:11
HD
Business growth concept in graph chart animation on black background. Statistics bars columns growth, positive increase chart. Increase graph icon suitable for business and finance concepts
00:08
HD
Falling Bar Chart Icon with Downward Arrow on Green Screen
00:10
HD
Happiness level indicator scale. Low normal & high meter infographic animation on black background. Showing high happiness level color gauge indicator for emotional well-being and mental health.
00:10
HD
Cost wording on decrease money with down arrow. Cost Management, Economy recession, low budget, Effective business, black 4k
00:10
HD
Darkened newspaper headlines announce financial crisis fears
00:15
HD
Business growth concept in graph chart showing marketing sales profit increasing to future target . growing business concept. Clean Hi-tech style technology chart
00:10
HD
4k Dollar Banknotes and Coins with Down Arrow. Financial Loss Concept Animation Video
00:10
HD
Worried investor with megaphone shouting about financial market crash and economic recession with falling arrow
00:10
HD
Black bar graph with downward arrow indicating decline on white. Bar graph decline trend. Minimalist black bar graph showing falling financial data with a descending arrow on white backdrop.
00:06
HD
3D Business Statistics Bar Chart with Downward Arrow Showing Financial Decline, Falling Revenue, Market Loss and Negative Growth Data Visualization on Green Screen
00:05
HD
 blue bar chart showing a downward trend with percentage and dollar symbols representing reduced spending and financial decrease on a dark grid backdrop Keywords: finance, economy, business. 4k
00:10
HD
Yemen Oil Price Falling with Oil Barrels Downward Green Arrow and 3D Financial Data Visualization Graphs for Economy and Business Concept
00:11
HD
Glowing neon animation of dollar sign line icons with red and blue downward arrows, illustrating business profit movement, market direction, and financial chart concepts on a dark background
00:10
HD
Dynamic Real Estate Mortgage Rate Alert Notification Looping Animation
00:05
HD
Abstract increase icon on green background. Dollar rate up looped icon. Reduce costs sign and symbol. 4k video animation
00:06
HD
Laptop Screen Displays Falling Coins and Downward Arrow Icon.
00:08
HD
fire danger level indicator scale. Low normal & high meter infographic animation. Showing high fire danger level color gauge indicator. on a white background 4k animation video
00:10
HD
Glowing neon line of dollar sign icon. Dollar rate decrease icon animation . Money symbol with stretching arrow down. Rising prices. Business cost sale icon.
00:10
HD
Zinc level indicator scale. Low normal & high meter infographic animation on black background. Showing high zinc level color gauge indicator for nutrition and immune health monitoring
00:10
HD
Cambodia Crude Oil Price Decline with Oil Barrels and Downward Green Arrow
00:11
HD
Business Loss, Market Crash, and Economic Crisis Concept with Warning Symbol. Glowing Neon Line Chart Going Down with Downward Arrow and Red Explanation Triangle On Dark Grid Background.
00:20
HD
Icon representing falling oil prices with a dollar sign and downward arrow
00:06
HD
Abstract graphic illustrating a continuous downward trend, featuring a decreasing bar chart, diagonal line, and multiple descending arrows, symbolizing reduction
00:05
HD
Negative business outcomes tracked on a computer interface to help investors evaluate asset value shifts and profit drops
00:15
HD
Minimal flat illustration of an orange human icon with a dollar symbol and a downward arrow, representing income decrease, salary reduction, financial loss, expense growth, or business decline on
00:10
HD
Business decline bar chart animation with falling line graph and shadow effects on transparent background. Indicate revenue decline, financial loss, negative growth
00:06
HD
Business loss falling down with dollar icon, black background. financial graph chart. Financial crisis and dollar loss diagram with downfall arrow. motion graphic video..
00:10
HD
Downward arrow with dollar icon animation on green background. Financial decrease trend with dollar sign. Dollar symbol financial loss chart line for bankruptcy price drop and market loss animation
00:08
HD
Digital bar chart lines compare market volatility trends using dual arrows. Financial analysis software modules look crisp across this grid monitor bar chart framework. Data charts update.

00:10
HD
Financial planning showing secure budgeting, expense tracking, and strategic analysis for business optimization and fiscal responsibility
00:17
HD
Project failure concept featuring a declining bar chart and downward arrow. Suitable for business loss, poor performance, financial decline, and project risk concepts.

00:10
HD
Azerbaijan Crude Oil Price Drop with Oil Barrels Downward Green Arrow and 3D Financial Data Visualization Graphs for Economy and Business Concept
00:11
HD
Declining Online Store Sales Concept with Smartphone, Packages, Warning Sign and Downward Arrow
00:06
HD
3D Business Statistics Bar Chart with Downward Arrow Showing Financial Decline, Falling Revenue, Market Loss and Negative Growth Data Visualization on Green Screen
00:05
HD
Energy price fluctuations displayed on gas stove with dynamic graphics
00:15
HD
Animated Scissors Cutting a Dollar Bill  - Transparent
00:10
HD
chili pepper level indicator scale. Low normal & high meter infographic animation. Showing high chili pepper level color gauge indicator. on a black background 4k animation video
00:10
HD
Glowing neon line of dollar sign icon. Dollar rate decrease icon animation . Money symbol with stretching arrow down. Rising prices. Business cost sale icon.
00:10
HD
Chili pepper level indicator scale. Low normal & high meter infographic animation on black background. Showing high chili pepper level color gauge indicator for food cooking and Scoville scale.
00:10
HD
Morocco Oil Prices Decline with Oil Barrels, Gold Coins and Downward Green Arrow, 3D Economic and Financial Market Concept
00:11
HD
Hand-Drawn Up Down Arrow Direction 2D Animation on Green Screen
00:06
HD
Arrow up and down icons. Low or high icon. Price, sale, rate or profit going up or down symbol with arrow sing.
00:10
HD
Blue Hand Drawn Down Arrow Doodle Animation 4K - Sketch Style Decrease Download Indicator for Business Infographic Alpha Channel Motion
00:10
HD
Recession trends on a digital display screen showing global business decline and negative financial performance for annual reports
00:15
HD
Selenium level indicator scale. Low normal & high meter infographic animation on black background. Showing high selenium level color gauge indicator .
00:10
HD
Business decline bar chart animation with falling line graph and shadow effects on transparent background. Indicate revenue decline, financial loss, negative growth
00:06
HD
Food additive level indicator scale. Low normal high meter infographic animation on black background. Showing high food additive level color gauge indicator for nutrition and food safety monitoring.
00:10
HD
Animated insulin level meter decreasing from normal to low level. low insulin, hormone imbalance and diabetes
00:07
HD
Bar chart animation displays a checklist and a downward arrow. Business task failure metrics track across this active bar chart. Negative corporate operational performance marks the bar chart.
00:12
HD
Capital market downturn exposure concept with financial charts, percentage symbol, dollar sign, falling arrows, and currency, reflecting investment risks and economic fluctuations
00:17
HD
financial loss and market downturn concept video,bearish market trend financial analysis,business decline financial loss market downturn graph chart concept 4k vbideo.
00:10
HD
Malawi Oil Price Falling with Oil Barrels Downward Green Arrow and 3D Financial Data Visualization Graphs for Economy and Business Concept
00:11
HD
Financial Market Crash and Economic Recession Animation with Falling Graph and Money Bag
00:10
HD
A computer screen displaying the text “Profit and Loss” and illustrations of gears
00:12
HD
A decline button and a downward red arrow animation on a green screen background.
00:15
HD
Rising Falling Graph Animation Green Screen
00:06
HD
South Africa economic bar chart graph showing decreasing downturn with national Flag 3D animation on black background.
00:16
HD
Countdown Clock Motion Graphics with Smooth Time Reduction Visualization
00:12
HD
Carbon monoxide level indicator scale. Low normal high meter infographic animation on black background. Showing high carbon monoxide level color gauge indicator for air quality and safety monitoring.
00:10
HD
Equatorial Guinea Oil Prices Decline with Oil Barrels, Gold Coins and Downward Green Arrow, 3D Economic and Financial Market Concept
00:11
HD
Animated price trend whit Bitcoin financial concept with two arrows  one up and one down. Suitable for cryptocurrency trends, financial market analysis, investments.
00:06
HD
Financial Loss Chart Line Icon. Animated line art graph showing downward trend and dollar coin for bankruptcy price drop and market loss animation. business loss concept animation
00:12
HD
Confidence Level Text or Word Low and Medium to High Meter Concept Animation on Black Background and Blue Screen
00:58
HD
An electronic monitor showcasing low financial growth trends and negative returns for corporate market analysis presentations
00:15
HD
Economic recession bar chart with downward red arrow, static front view of financial market crash
00:10
HD
abstract blue arrow. Business And Finance Growth Infographic Bar Graph. green profit signal.
00:10
HD
Meltdown Crisis Emergency Downturn Red Arrows Falling Down 3d Animation
00:08
HD
Green earth cover with Recycle symbol on green grass field on natural background. Waste and pollution elimination, clean and renewable energy concept, green world, eco friendly, environment day. Ecolo
00:10
HD
Red bar graph showing sharp decline with falling arrows. Financial failure chart for business economic market crisis. Digital bar chart animation for network alert.
00:06
HD
Business Investment Loss and Startup Failure Icon on Bright Green Chroma Key Background
00:05
HD
A falling arrow and a judge's gavel. Staff cuts, budget sequestration or economic recession. Concept of financial decline and government fiscal policy today. Economic hardship.
00:21
HD
Vanuatu Oil Price Falling with Oil Barrels Downward Green Arrow and 3D Financial Data Visualization Graphs for Economy and Business Concept
00:11
HD
 blue bar graph depicting decreasing data costs with percentage and dollar symbols against a dark grid background Keywords: data cost, decreasing, bar graph, neon blue, financial chart, data .4k
00:10
HD