Un lien pour définir votre mot de passe a été envoyé à : Pour accéder à vos achats à l’avenir, vous aurez besoin d’un mot de passe.
Obtenez 3 vidéos ou 25 images avec un essai gratuit
Nouveaux filtres ajoutés
Trier par

13 054 résultats pour decrease arrow dans vidéos

Saba Flag and Bar Chart Graph Showing Decreasing Values a Red Arrow Economic Crisis Concept
00:11
HD
Animated Financial Chart Showing Quarterly Business Decline
00:10
HD
Financial market crash with downward red arrow, dynamic camera movement following stock chart decline
00:10
HD
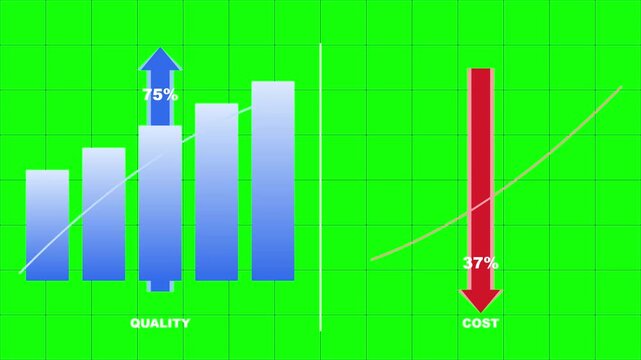
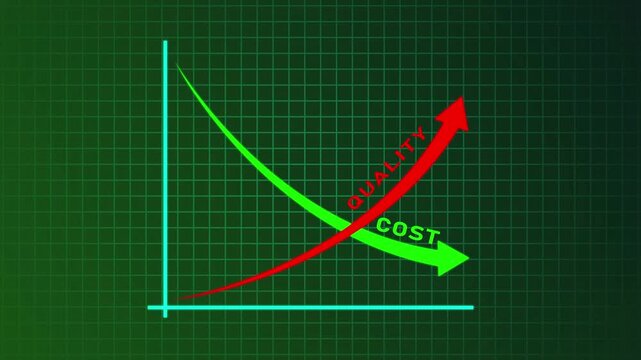
Cost and quality control concept, The concept of cost is shown by the downward arrow, and the concept of quality is shown by the upward arrow. Cost and quality comparison
00:10
HD
Animated Comparison Graph Showing Increasing Quality and Decreasing Cost on Green Screen Background
00:10
HD
Minimum profit levels illustrated on an electronic screen representing long term budget cuts and capital risk adjustments
00:15
HD
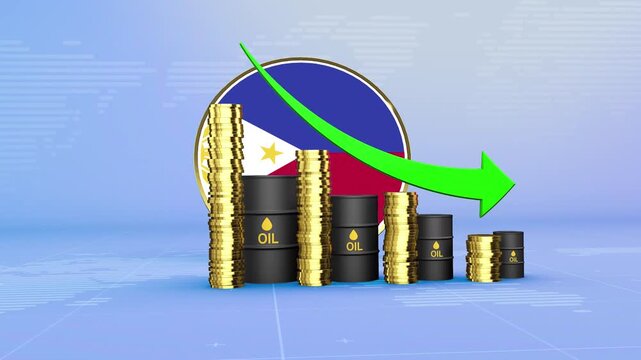
Philippines Oil Prices Decline with Oil Barrels, Gold Coins and Downward Green Arrow, 3D Economic and Financial Market Concept
00:11
HD
Orange Down Arrow Animation with Downward Directional Indicator Movement on Green Screen Chroma Key Seamless Loop Motion Graphics
00:10
HD
Bear Market and Economic Crisis Concept with Broken Dollar Coin and Falling Arrow cartoon animation
00:10
HD
Animated business graph chart icon with a decreasing trend on a black background, bar graph animation ,multi colour bar graph  Business & Financial Chart Animation,Animated Stock Market Bar Graph
00:17
HD
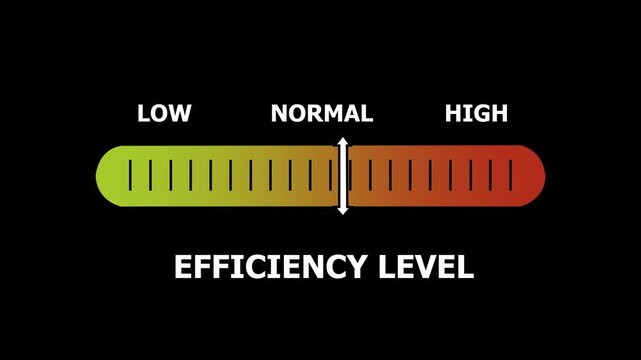
efficiency level indicator scale. Low normal & high meter infographic animation. Showing high efficiency level color gauge indicator. on a black background 4k animation video
00:10
HD
Neon yellow magnifying glass reveals a descending bar graph with an arrow
00:08
HD
4k footage animation zoom icons. 3D modeling. Scale and Resize Icon Set - 3D Cube and Hexagon Expansion Symbol with Arrows in Solid, Outline, Doodle. Enlargement and reduction. Changing an object.
00:20
HD
Business growth concept in graph chart showing marketing sales profit increasing to future target . growing business concept. Clean Hi-tech style technology chart
00:10
HD
A cracked stone arrow pointing downwards against a solid green studio background
00:07
HD
Declining Money Value and Financial Loss Illustrated by Stacks of Coins with Downward Arrows, Representing Falling Currency Value, Reduced Wealth, Market Decline, Inflation, and Economic Pressure
00:10
HD
Analyzing continuous financial returns, income, and business investments over time, balancing profitability with potential financial risks
00:17
HD
Animated Three Red Arrows Pointing Down with Bounce Effect - Green Screen Chroma Key
00:15
HD
Price Drop Discount Animation with Shopping Box and Falling Coins on Green Screen Background
00:08
HD
Line icon of a group of people beneath a downward falling arrow representing team decline business loss and steadily falling overall performance level
00:10
HD
Glowing neon Financial interest rate and market trends concept. with percentage symbol, with red and green arrows, financial market fluctuation, interest rates, economic trend,
00:10
HD
Abstract decrease icon on white background. Royal blue dollar rate down looped icon. Reduce costs sign and symbol.
00:06
HD
reputation score level indicator scale. Low normal high meter infographic animation on black background. Showing high pressure level color gauge indicator.4k animation video
00:10
HD
Animated Trio of Neon Arrows Pointing Downwards on Chroma Key Green Screen for Video Production
00:08
HD
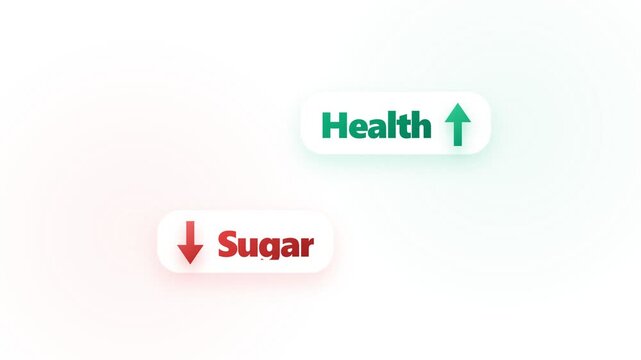
Reducing sugar intake improves health, represented by text and arrows.
00:08
HD
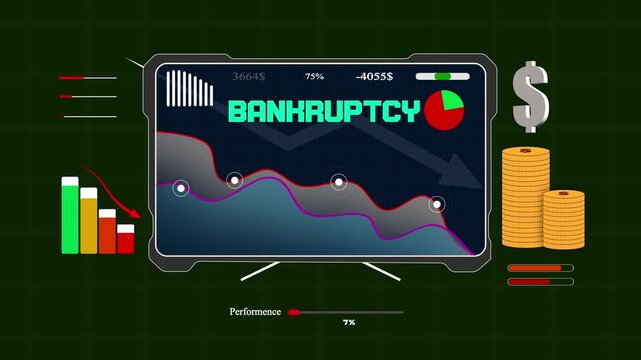
Financial distress animation on a digital monitor showing high-tech revenue analytics and profit decline for corporate marketing reports
00:15
HD
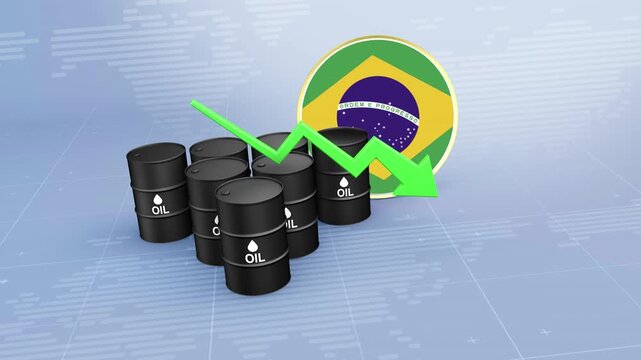
Brazil Crude Oil Price Decline with Oil Barrels and Downward Green Arrow
00:11
HD
Neon glowing down arrow with number 36 in futuristic digital style on black background on Black Background and features 4k Animation video
00:10
HD
A private house and a large red downward arrow. Falling housing prices and declining property values. Real estate market downturn and economic crisis scenario.
00:14
HD
COVID-19 risk level indicator scale. Low normal & high meter infographic animation on black background. Showing high COVID-19 level color gauge indicator for public health and disease monitoring.
00:10
HD
potassium k level indicator scale. Low normal & high meter infographic animation. Showing high ptassium k level color gauge indicator. on a white background 4k animation video
00:10
HD
decreasing bar chart animation with downward arrow loop footage
00:06
HD
3D euro symbol with down arrow
00:10
HD
Algeria Crude Oil Price Drop with Oil Barrels Downward Green Arrow and 3D Financial Data Visualization Graphs for Economy and Business Concept
00:11
HD
Global economic crisis concept featuring a globe, money symbol, and red downward arrow representing financial decline and market instability.
00:10
HD
Oil Price Decline and Falling Energy Market Value Illustrated by Multiple Oil Barrels with Downward Arrows, Representing Lower Crude Prices, Market Pressure, Supply Dynamics, and Economic Impact
00:10
HD
Animated bar chart showing growth and decline metrics
00:10
HD
Animated Red Arrows Pointing Down with Bounce Effect - Green Screen Chroma Key
00:15
HD
bank interest rates
00:06
HD
Black line icon of a dial weighing scale with up and down arrow signs representing weight change, scale calibration, load adjustment, and measurement
00:10
HD
Self-Actualization indicator scale. Low Normal High meter infographic animation on black background. Showing high self-actualization level color gauge indicator for personal growth and well-being.
00:10
HD
Abstract decrease icon on White background. Dollar rate down looped icon. Reduce costs sign and symbol. animation. 4k video...
00:10
HD
cpu temperature level indicator scale. Low normal high meter infographic animation on black background. Showing high pressure level color gauge indicator.4k animation video
00:10
HD
4K Animated Speedometer Gauge Increasing from Green to Red - Car Dashboard Dial with Accelerating Speed Arrow and Colorful Progress Indicator, High Performance Motion Graphics Footage.
00:10
HD
Personal Finance Savings Illustration with Piggy Bank, Falling Market Arrow, Coins and Money Bag for Financial Loss
00:06
HD
Supply shortage trends shown on an electronic monitor to visualize business inventory and financial drops
00:15
HD
Benin Oil Prices Decline with Oil Barrels, Gold Coins and Downward Green Arrow, 3D Economic and Financial Market Concept
00:11
HD
Neon style cryptocurrency data diagram animation for stock market analysis video
00:08
HD
Green Rectangle Highlighted by Red Vertical Arrows Indicating Compression or Focus
00:08
HD
Ticker display. table grid Stock exchange screen number with financial trade index rates, finance fund stocks price increase and decrease charts arrow up and down
00:20
HD
zinc level indicator scale. Low normal & high meter infographic animation. Showing high zinc level color gauge indicator. on a black background 4k animation video
00:10
HD
Business graph. loss graph direction. damage business graph. down business graph icon. business or finance concept icon animation.
00:07
HD
Bar chart showing descending bars with downward arrow animation
00:06
HD
New Zealand Oil Price Falling with Oil Barrels Downward Green Arrow and 3D Financial Data Visualization Graphs for Economy and Business Concept
00:11
HD
Close up of businessman typing on white laptop then drawing upward trend in notebook
00:16
HD
Business concept: reducing cost while increasing financial growth and optimization strategy, infographic animation for corporate presentations
00:10
HD
Quality improvement and cost reduction concept with blue quality line rising and red cost line falling. Concept of business strategy, management, efficiency and performance optimization
00:12
HD
3D White Arrows Falling Down Rain Particle Animation on Green Screen Background Chroma Key
00:15
HD
Countdown Clock Motion Graphics with Smooth Time Reduction Visualization
00:12
HD
Policy level indicator scale. Low normal & high meter infographic animation on black background. Showing high policy level color gauge indicator for business governance and management analysis.
00:10
HD
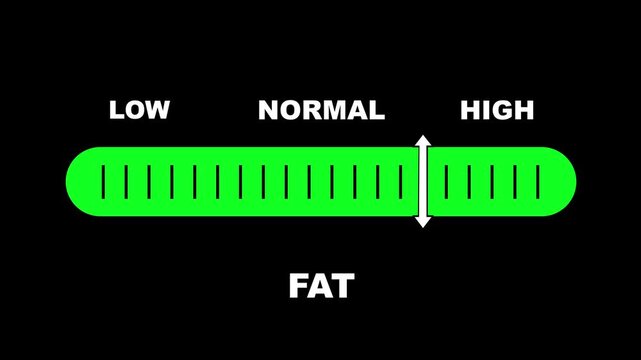
Fat level indicator scale. Low normal high meter infographic animation on black background. Showing high fat level color gauge indicator for body composition and health monitoring
00:10
HD
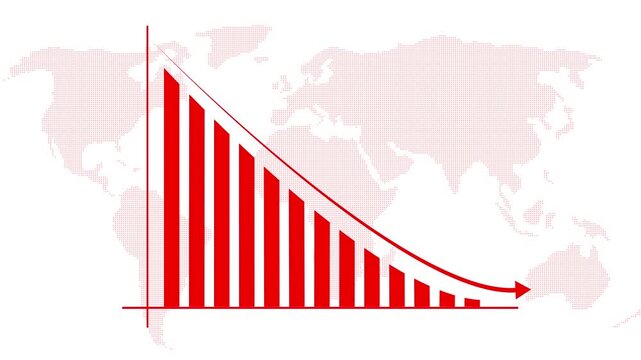
Red bar graph metrics track economic inflation drops across a world map. Financial market asset risk overviews look crisp using this data charting bar graph dashboard. Graph statistics decline.
00:12
HD
performance score level indicator scale.Low normal high meter infographic animation on black background. Showing high pressure level color gauge indicator for health monitoring and safety analysis.4k
00:10
HD
down-directional red arrow loop animation with shadow on white background ideal for business, investment, financial, and failure. Arrow icon concept animation, arrows sign down
00:10
HD
Business Growth Graph Going down - Financial growth  Loss business graph icon animation 4K
00:10
HD
Price Drop Label with a Red Arrow Indicating a Discount on a Dark Background
00:10
HD
Belgium Crude Oil Price Decline with Oil Barrels and Downward Green Arrow
00:11
HD
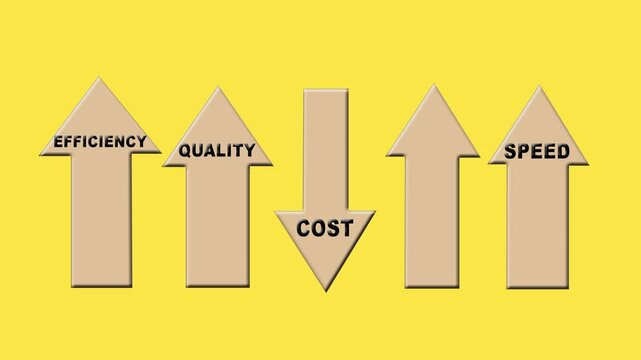
Business optimization concept. increasing efficiency, and speed while reducing costs
00:08
HD
black business graph chart growth up down or signal on white background with alpha channel. Business up and down signal concept.
00:07
HD
Ticker display. table grid Stock exchange screen number with financial trade index rates, finance fund stocks price increase and decrease charts arrow up and down
00:20
HD
anxiety level indicator scale. Low normal & high meter infographic animation. Showing high anxiety level color gauge indicator. on a black background 4k animation video
00:10
HD
Neon blue line business graph icon Quality control and company cost reduction. Successful strategy and management. light magenta collar animation and black background
00:10
HD
Cyan Bar Chart with Downward Trend Arrow on Grid Background graph decline
00:12
HD
Cuba Oil Price Falling with Oil Barrels Downward Green Arrow and 3D Financial Data Visualization Graphs for Economy and Business Concept
00:11
HD
Transformative Waste Reduction Zero Animation Highlighting Recycling Process
00:05
HD
Declining Oil and Currency Value Illustrated by Oil Barrels, Gold Coins, and Downward Arrows, Representing Falling Commodity Prices, Reduced Wealth, Economic Pressure, Inflation, and Financial Loss
00:10
HD
4K Stock Market Crash Gold Coins Bar Chart Downtrend on Green Screen Chroma Key
00:05
HD
Crisis icon animation
00:06
HD
Glowing neon line of dollar sign icon. Dollar rate decrease icon animation . Money symbol with stretching arrow down. Rising prices. Business cost sale icon.
00:10
HD
A down arrow features a sharp, downward-pointing design, often illuminated in bright neon colors. It symbolizes descent, lowering, or direction, drawing attention with its vibrant, bold, and dynamic .
00:10
HD
Solar radiation level indicator scale. Low normal & high meter infographic animation on black background. Showing high solar radiation level color gauge indicator for weather and climate monitoring.
00:10
HD
Global Finance and Stock Market Trends with Golden Coin Globe and Arrows
00:08
HD
quality index level indicator scale.Low normal high meter infographic animation on black background. Showing high pressure level color gauge indicator for health monitoring and safety analysis.4k
00:10
HD
Cloud of CO2, carbon emission, pollution reduction icon. Ecology environment cleaning. Loop. Green screen, chromakey
00:05
HD
Quality and cost control concept on transparent background. Successful organization strategy and management quality control. Percentage icon of quality with up arrow and cost with down arrow. 4K,,
00:06
HD
weight level indicator scale. Low normal & high meter infographic animation. Showing high weight level color gauge indicator. on a black background 4k animation video
00:10
HD
Paraguay Oil Prices Decline with Oil Barrels, Gold Coins and Downward Green Arrow, 3D Economic and Financial Market Concept
00:11
HD
4k Footage of a losing trader woman with short hair sits alone in a dimly lit, modern office. She has her head in her hands and is surrounded by multiple monitors displaying chart.
00:08
HD
abstract decreasing business graph chart animation. bad economy recession graph chart.
00:08
HD
Mindfulness Level Text or Word Low and Normal to High Meter Concept Animation on Black Background and Blue Screen
00:58
HD
temperature level indicator scale. Low normal & high meter infographic animation. Showing high temperature level color gauge indicator. on a white background 4k animation video
00:10
HD
Business decline graph with a falling purple arrow on a black background representing financial loss or market crash.
00:10
HD
Isolated down business graph icon animation on background.4k
00:10
HD
Vietnam Oil Price Falling with Oil Barrels Downward Green Arrow and 3D Financial Data Visualization Graphs for Economy and Business Concept
00:11
HD
Graph chart downtrend symbol graph - success. colored diagram. Graph showing rising arrow. Success arrow growth.
00:10
HD
White Downtrend Chart and Arrow Graphic in Modern Monochrome Style
00:08
HD
Display price of stock market
00:12
HD
Fast Motion Pixel Negative Percentage Animation. 0 to -500 Digital Number Counter for Stock Market Vlogs
00:07
HD
Glowing neon line of dollar sign icon. Dollar rate decrease icon animation . Money symbol with stretching arrow down. Rising prices. Business cost sale icon.
00:10
HD
Falling chart with exclamation mark on transparent alpha channel background, symbolizing financial crisis, economic downturn, risk alert, business loss, negative trend, and urgent warning illustration
00:07
HD