Un lien pour définir votre mot de passe a été envoyé à : Pour accéder à vos achats à l’avenir, vous aurez besoin d’un mot de passe.
Obtenez 3 vidéos ou 25 images avec un essai gratuit
Nouveaux filtres ajoutés
Trier par

13 054 résultats pour decrease arrow dans vidéos

Animated black downward trend line graph on green screen, financial market decline and economic recession concept
00:10
HD
Red Falling Bar Chart Decline Arrow Graphic
00:10
HD
Conceptual image of declining real estate market with housing symbol, percentage mark, and silhouettes of business people in a modern urban environment Sigmoid
00:10
HD
Bosnia and Herzegovina Oil Prices Decline with Oil Barrels, Gold Coins and Downward Green Arrow, 3D Economic and Financial Market Concept
00:11
HD
Hand change wooden block with OIL text to UP and Down arrow symbol icon. Trade war, stocks, financial, cut loss and economic concept
00:10
HD
Minimalist business chart animation with downward trending  arrow and percentages 4k animation showing financial loss over with background dynamic...
00:10
HD
A stark red 3d chart depicting a sharp decline with a downward arrow, symbolizing financial loss animated 4k video
00:05
HD
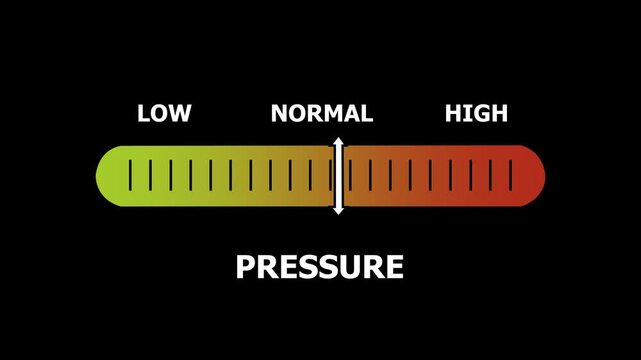
pressure level indicator scale. Low normal & high meter infographic animation. Showing high pressure level color gauge indicator. on a black background 4k animation video
00:10
HD
Drop in revenue on a digital monitor showing successful methods to handle sudden financial loss for corporate annual report projects
00:15
HD
Glowing Neon Percentage Growth and Decline Icon Animation with Up and Down Arrows on Black Background, Financial Business Statistics, 4K Motion Graphics Loop..
00:10
HD
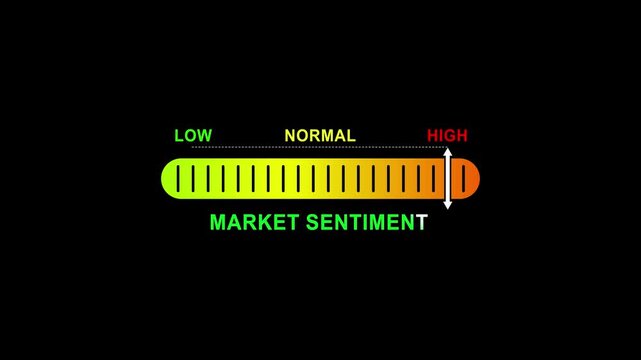
market sentiment level indicator scale. Low normal high meter infographic animation on black background. Showing high pressure level color gauge indicator.4k animation video
00:10
HD
Business chart illustrating improving quality and cost reduction with blue upward and red downward arrows. Visualize performance optimization for business strategy, management and resource efficiency
00:07
HD
Neon Line Percentage Icon Animation Representing Quality Control, Business Growth, and Cost Reduction Strategy with Upward Arrow for Success and Downward Arrow for Expense,
00:12
HD
Black Arrow Graph Line Moving Downward on a Bright Blue Background movement
00:10
HD
Close-up stock market trading screen with market data, trading volume, prices and percentage changes. Investment strategy, analyzing, data spreadsheet, financial figures, trading board, exchange infor
00:10
HD
Animated progesterone level meter decreasing from normal to low level for concept.3d video white background.
00:10
HD
Continuous single line drawing of a british pound currency symbol with a downward arrow representing financial decline or loss isolated on white background, Full length one line animation. 4K video
00:07
HD
Japan Oil Price Falling with Oil Barrels Downward Green Arrow and 3D Financial Data Visualization Graphs for Economy and Business Concept
00:11
HD
A neon yellow outline of a phone displays a chart with a down turning arrow and a thumbsdown symbol
00:08
HD
Declining Bar Graph - Visualizing Economic Downturn and Market Trends.
00:05
HD
Red Downward Arrow Animation for Economic Decline – Vertical Format with Alpha Channel
00:06
HD
Neon cost reduction icon animation. Dollar down icon. Low price dollar concept. Cash with down arrow stocks graph, concept of financial crisis, market fall. Abstract neon glowing reduce-cost icon .
00:10
HD
Quality and cost control concept on transparent background. Successful organization strategy and management quality control. Percentage icon
00:10
HD
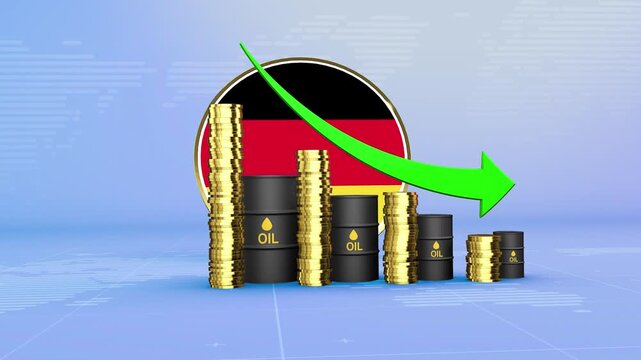
Germany Oil Prices Decline with Oil Barrels, Gold Coins and Downward Green Arrow, 3D Economic and Financial Market Concept
00:11
HD
Green pedestrian countdown timer changes to yellow then red. sequence shows numbers decreasing from 04 to 52 with corresponding signal lights and arrows
00:19
HD
3D Business Statistics Bar Chart with Downward Arrow Showing Financial Decline, Falling Revenue, Market Loss and Negative Growth Data Visualization on Green Screen
00:05
HD
Decline in value of securities. Loss of equity stock assets. Business loss falling down with dollar icon.HD, video, black, background,
00:10
HD
​Pixelated white downward arrows continuously falling against a vibrant red background
00:12
HD
Low-yield financial assets tracked on a high-tech monitor illustrating sudden profit contraction and shifting charts
00:15
HD
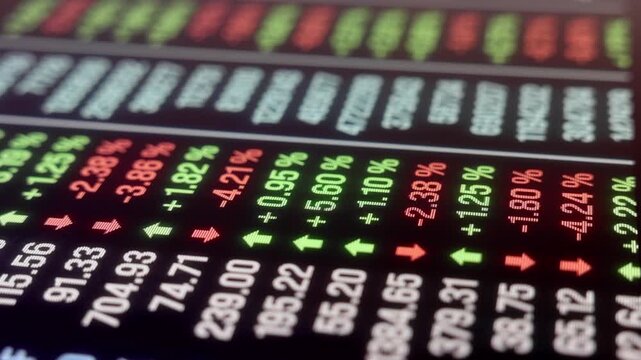
Ticker display. table grid Stock exchange screen number with financial trade index rates, finance fund stocks price increase and decrease charts arrow up and down
00:20
HD
success rate level indicator scale. Low normal high meter infographic animation on black background. Showing high pressure level color gauge indicator.4k quality animation video
00:10
HD
deciber level indicator scale. Low normal & high meter infographic animation. Showing high deciber level color gauge indicator. on a black background 4k animation video
00:10
HD
Global economic crisis concept featuring a globe, money symbol, and red downward arrow representing financial decline and market instability.
00:10
HD
urgency level indicator scale. Low normal & high meter infographic animation. Showing high urgency level color gauge indicator. on a black background 4k animation video
00:10
HD
Business growth concept animation, Business line arrow .Chart arrow still goes Down animation. Graph decreasing. Business animation. Economy concept. arrow down
00:10
HD
Fire danger level indicator scale. Low normal & high meter infographic animation on black background. Showing high fire danger level color gauge indicator for safety and risk monitoring.
00:10
HD
Financial growth and decline animation with green up arrow red down arrow and spinning gold dollar coin on green background
00:15
HD
Syria Oil Price Falling with Oil Barrels Downward Green Arrow and 3D Financial Data Visualization Graphs for Economy and Business Concept
00:11
HD
Businessman decreasing transaction fees and charges in financial services like banking and foreign exchange, promoting cost efficiency and beneficial economic changes for clients
00:17
HD
Arrears progress past covenant deadlines to a garnishment order, with payroll withholding marking the path toward balance reduction. Flat 3D style.
00:08
HD
Declining Business Line Chart Arrow Animation on White Background
00:07
HD
Settings optimization icon animation. performance improvement sign. gear with bar chart.
00:10
HD
Declining Oil Market Value Illustrated by Progressively Smaller Oil Barrels, Downward Arrows, and Percentage Symbols, Representing Falling Prices, Reduced Rates, Lower Demand, and Economic Decline
00:10
HD
Poland Oil Prices Decline with Oil Barrels, Gold Coins and Downward Green Arrow, 3D Economic and Financial Market Concept
00:11
HD
Glowing neon line Global economic crisis news icon isolated on black background. World finance crisis. 4K Video motion graphic animation.
00:10
HD
Abstract dollar sign icon and up arrow animation on a green background. Upward arrow and dollar icon. High pricing icon. profit, investment, growth business, economy, finance and success concept
00:10
HD
stock market red arrow upward growth graph chart animated continuous single line drawing isolated on green screen background, line art animation illustration design sign symbol video direction loss
00:10
HD
Golden dollar coin falls to indicate financial market losses. Falling dollar coin visualizes negative corporate revenue trends. Economic inflation concept using a classic dollar coin.
00:12
HD
Market downtrend analysis featuring an animated electronic screen with falling business statistics for finance reports
00:15
HD
Minimalist Line Drawing Animation of Business Workflow Optimization Task Delegation and Waste Reduction Process Infographic
00:10
HD
safety level indicator scale.Low normal high meter infographic animation on black background. Showing high pressure level color gauge indicator for health monitoring and safety analysis.4k
00:10
HD
Balance Scale with Upward Green Arrow and Downward Red Arrow Comparison Animation
00:11
HD
Stock market crash concept featuring infographic with falling red arrow. Visual representation of market decline and financial loss.
00:15
HD
trigl ycerides level indicator scale. Low normal & high meter infographic animation. Showing high triglycrides level color gauge indicator. on a black background 4k animation video
00:10
HD
Glowing neon line of dollar sign icon. Dollar rate decrease icon animation . Money symbol with stretching arrow down. Rising prices. Business cost sale icon.
00:10
HD
Risk level indicator scale. Low normal high stress meter infographic animation on white background. Showing high risk level color gauge indicator for business, finance and safety analysis animation.
00:10
HD
Digital Red Neon Downward Arrow HUD Interface with Decreasing Countdown Timer and Data Monitor
00:15
HD
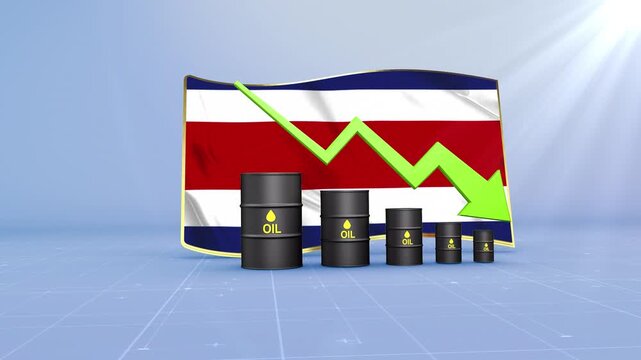
Costa Rica Oil Price Falling with Oil Barrels Downward Green Arrow and 3D Financial Data Visualization Graphs for Economy and Business Concept
00:11
HD
Financial analysis displaying an upward trend, indicating potential market recovery and economic expansion, with concepts of decrease, risk, and data management for business success
00:17
HD
Neon Cost Reduction Dollar Icon Animation, Falling Stock Market Graph and Financial Crisis Concept, 4K
00:10
HD
Vertical Seamless Loop Red Bar Chart Declining with Falling Arrow on Clean White Background Business Loss Concept
00:15
HD
dollar down icon symbol.Dollar price collapse. Dollar price fall.Money reduction icon. motion graphic of Dollar currency price drop concept. 4k motion video
00:10
HD
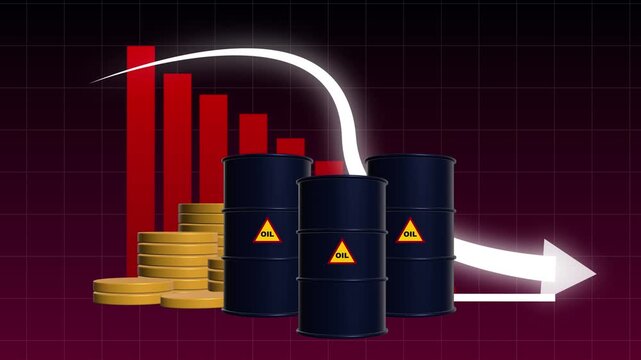
Declining Oil Market and Falling Financial Value Concept with Red Downward Chart, Oil Barrels, Gold Coins, and a Large Arrow Showing Economic Downturn
00:10
HD
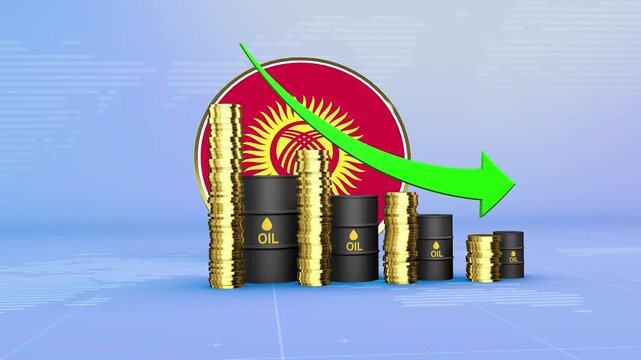
Kyrgyzstan Oil Prices Decline with Oil Barrels, Gold Coins and Downward Green Arrow, 3D Economic and Financial Market Concept
00:11
HD
Professional Business Financial Bar Graph Showing Downward Trend, Economic Loss and Market Decline Animation
00:15
HD
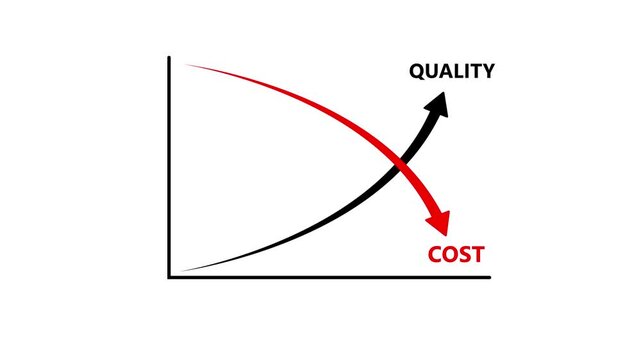
Rising quality bar chart and declining cost curve showing quality control and cost reduction up arrow and cost with down arrow.4k
00:10
HD
Green 3D line arrow pointing upward showing stock market growth, financial investment uptrend, business profit increase, economic performance rise, and positive trading concept
00:20
HD
red line is drawn on a black background, representing a downward trend. Concept of decline or loss, possibly related to a financial or economic situation
00:10
HD
Downward business trajectory on a digital monitor showing professional financial performance issues for corporate reports and projects
00:15
HD
Hand drawn business flipchart showing financial loss. 4K Video
00:10
HD
Balance amount decreasing from 10000 to 0 dollars.Decreasing Amount Animation on blue background.
00:10
HD
Business decline bar chart animation financial downtrend
00:06
HD
Cost Optimization Diagram with Icons. Business, Technology, Internet and network concept.
00:10
HD
satisfaction rating level indicator scale. Low normal & high meter infographic animation. Showing high satisfaction rating level color gauge indicator. on a black background 4k animation video
00:10
HD
Red Neon Dollar Sign with Downward Arrows in Circle
00:10
HD
Weight level indicator scale. Low normal & high meter infographic animation on black background. Showing high weight level color gauge indicator for body weight and health monitoring.
00:10
HD
Red Downward Arrow with Dollar Sign Symbolizing Economic Recession or Financial Loss
00:15
HD
Namibia Oil Price Falling with Oil Barrels Downward Green Arrow and 3D Financial Data Visualization Graphs for Economy and Business Concept
00:11
HD
Debt burden relief concept depicts extending payment schedules, symbolized by a clock with a chained weight and money bag within a cyclical arrow, reduced financial pressure
00:17
HD
Recycle symbol made of leafy greenery. Conceptual video of recycling environmental protection, eco friendly, waste reduction, Sustainable living. Earth day.
00:15
HD
Quality improvement and cost reduction concept with blue quality line rising and red cost line falling. Concept of business strategy, management, efficiency and performance optimization
00:12
HD
Falling Downward Arrows Animation with Alpha Channel – 4K Transparent Background Motion Graphic Clip.
00:06
HD
Falling Oil Prices and Market Decline Oil Barrels with Downward Arrows Symbolize Lower Energy Values, Weak Demand, Financial Pressure, and a Bearish Commodity Market
00:10
HD
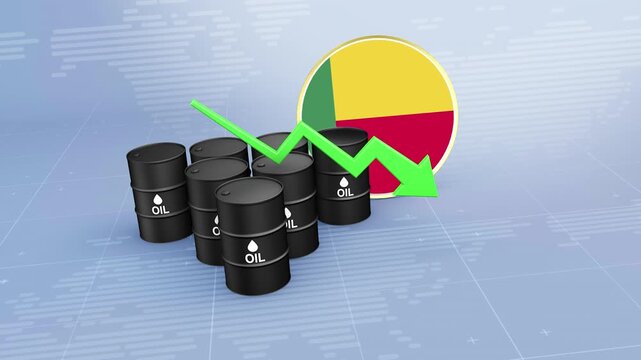
Benin Crude Oil Price Decline with Oil Barrels and Downward Green Arrow
00:11
HD
3d animation financial loss or economic decline with stacked coins decreasing in size, a red downward arrow, and a warning symbol representing caution or risk with alpha channel
00:10
HD
Stock market crash, red candlestick chart falling arrow, financial decline concept. Business crisis economy downturn, trading loss graph. Stock market crash risk
00:10
HD
3D euro coin with down arrow
00:10
HD
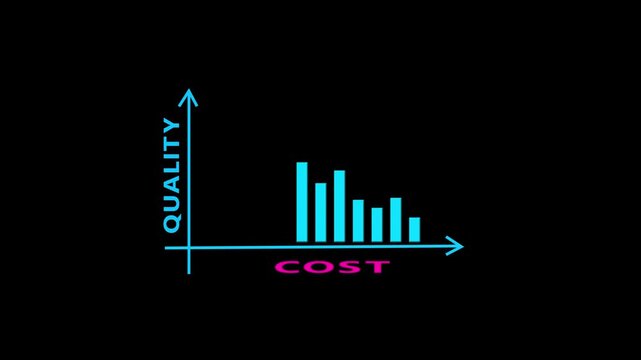
Glowing graph with upward arrow labeled "QUALITY" and downward arrow labeled "COST" on a dark background. Symbol of business strategy, pricing, production, efficiency, and trade-off between quality
00:10
HD
Downfall of market revenue on a digital display screen showing professional risk factors and rising charts for corporate projects
00:15
HD
Red cube with bold white arrow pointing upward, white background. Market growth and business success. Close-up.
00:05
HD
Down graph of the financial crisis graphic animation. Alpha channel. Businessman and arrow moving down on transparent background motion design. 4K resolution
00:05
HD
Mobile phone icon with arrows indicating zoom out or shrink function on black background
00:07
HD
Animated lquality Meter – Increasing and Decreasing Gauge from Good to Best Levels, Comparison Indicator for  Data Visualization,  perfomance, and Motion Graphic Reports
00:10
HD
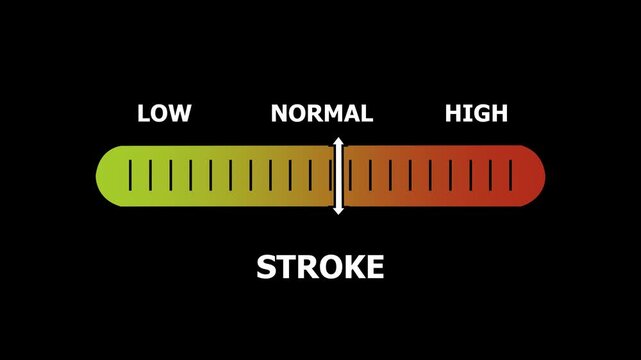
stoke level indicator scale. Low normal & high meter infographic animation. Showing high stroke level color gauge indicator. on a black background 4k animation video
00:10
HD
pH Level Alkaline meter concept on black background.
00:10
HD
COVID-19 risk level indicator scale. Low normal & high meter infographic animation on black background. Showing high COVID-19 level color gauge indicator for public health and disease monitoring.
00:10
HD
Digital Marketing content planning advertising strategy concept.Marketing Business concept on a futuristic computer display. marketing concept on black background.
00:10
HD
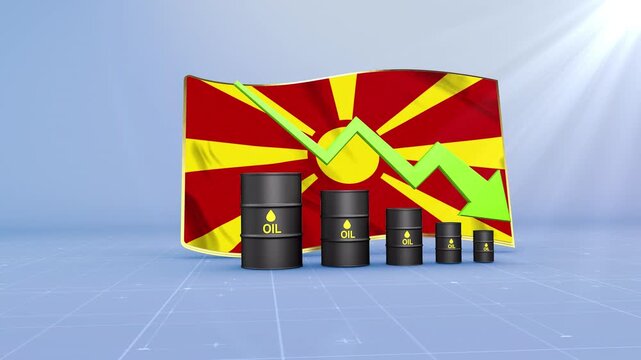
Macedonia Oil Price Falling with Oil Barrels Downward Green Arrow and 3D Financial Data Visualization Graphs for Economy and Business Concept
00:11
HD
Concept depicting global legal frameworks intersecting with societal participation, considering policy analysis and economic impacts on people's financial well being
00:17
HD
Business graph. loss graph direction. damage business graph. down business graph icon. business or finance concept icon animation.
00:07
HD