Se ha enviado un vínculo para establecer tu contraseña a: Para acceder a tus compras en el futuro, necesitarás una contraseña.
Consigue 10 imágenes de archivo con una versión de prueba gratuita
Se han añadido nuevos filtros
Ordenar por

201.500 resultados para increase and decrease en todos

19.768 resultados en vídeo
Volume level up and down.
00:16
Alta definición
Plant viruses cause mosaic patterns, yellowing, leaf curling, stunted growth, and reduced crop yields.
00:35
Alta definición
Animation of speaker volume with alpha channel, Speaker volume animation. sound up down icon
00:10
Alta definición
England economic bar chart graph showing decreasing downturn with national Flag 3D animation on black background.
00:16
Alta definición
Declining business bar chart with downward arrow representing falling sales, reduced revenue, financial losses, market decline, decreasing performance.financial loss icon.
00:10
Alta definición
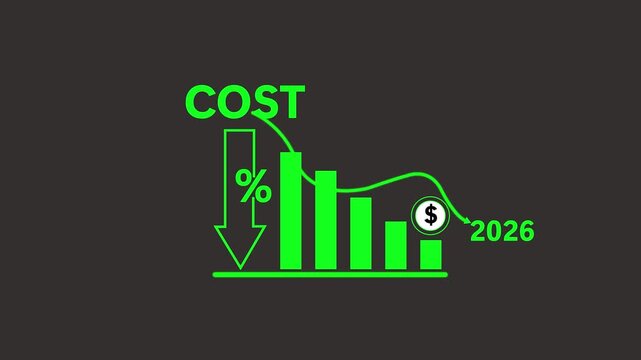
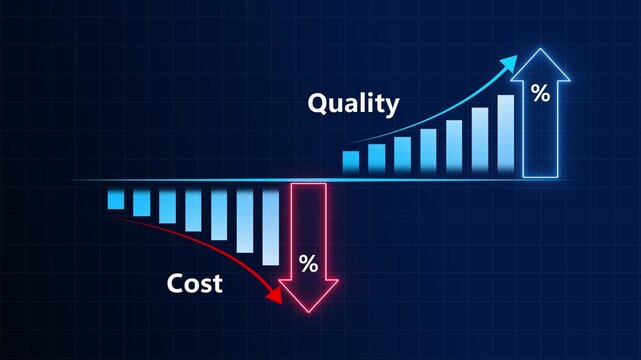
Cost reduction and cost saving through digital transformation, business cost and 2026 optimization, operational cost reduction, financial saving, and resource efficiency 4k video animation.
00:06
Alta definición
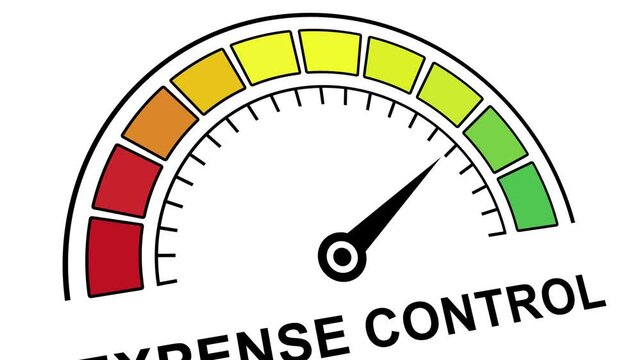
Dynamic expense control gauge animation featuring a moving needle pointing toward green success zones to represent financial management, budget optimization, cost reduction strategies, and
00:10
Alta definición
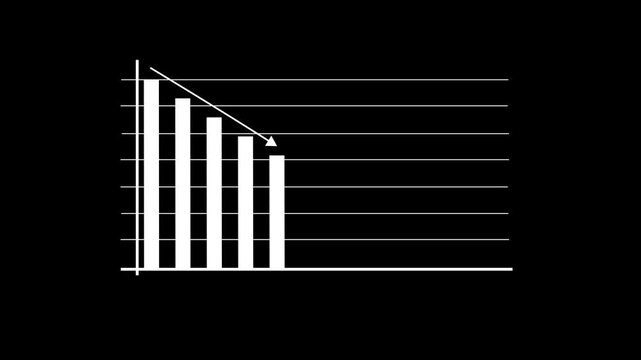
Business graph chart arrow line down white color animation on black background. growth concept white moving.
00:15
Alta definición
Bar chart animation with growth and decline. Bar chart financial market data analysis. Bar chart business statistics graphic on black background for performance.
00:09
Alta definición
Cinematic Growing Blue light lens flare [4K}
00:08
Alta definición
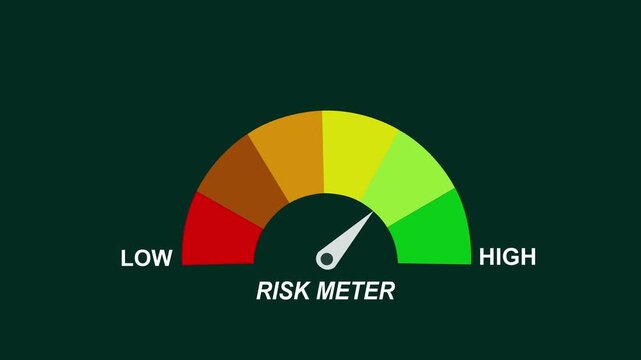
Risk Meter Animation Showing High Risk Level. Color Gauge Indicator for Business, Finance, and Safety Analysis. Risk Level Text or Word Low and Medium to High Meter. Motion graphics of alert meter
00:10
Alta definición
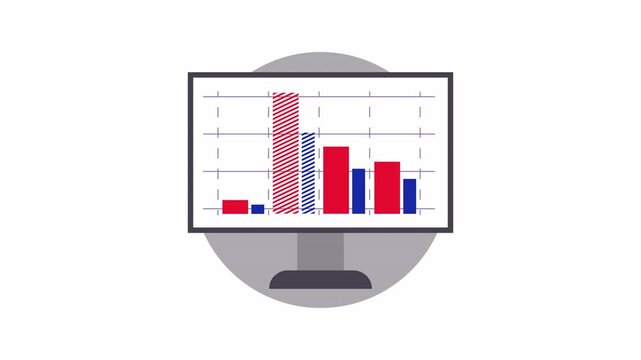
infographics elements bar graph with red and blue bars, suitable for financial reports, data analysis presentations, business analytics.
00:12
Alta definición