Se ha enviado un vínculo para establecer tu contraseña a: Para acceder a tus compras en el futuro, necesitarás una contraseña.
Consigue 10 imágenes de archivo con una versión de prueba gratuita
Se han añadido nuevos filtros
Ordenar por

779 resultados para fft en todos

59 resultados en vídeo
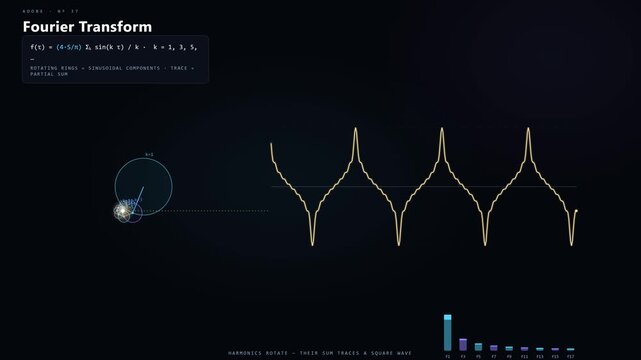
Fourier Transform – Signal Decomposes Into Frequency Spectrum and Harmonics
00:16
Alta definición
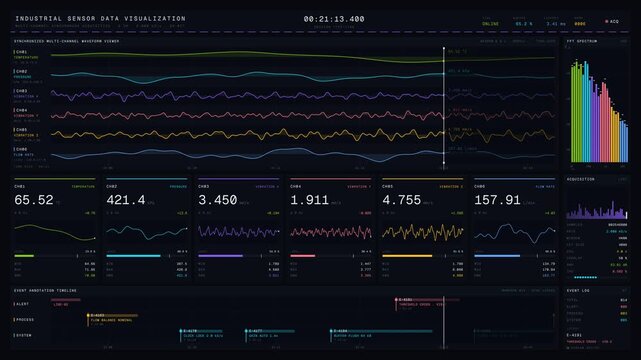
Experience a captivating industrial sensor data visualization featuring synchronized multi-channel waveforms in vibrant neon colors against a dark background, showcasing real-time analytics.
00:15
Alta definición
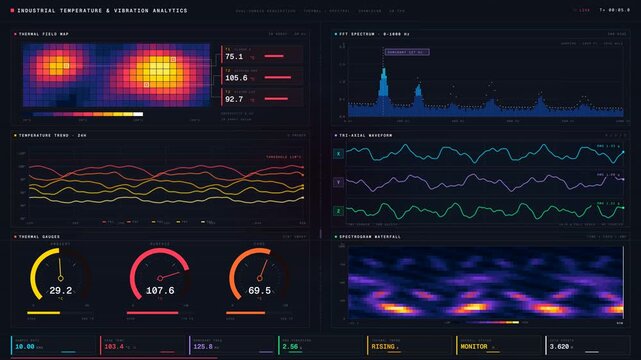
Explore the dual-domain industrial analytics dashboard showcasing temperature and vibration monitoring with vibrant thermal and spectral visualizations in a sleek interface.
00:15
Alta definición
Scientific FFT Signal Spectrum Visualization
00:18
Alta definición
Seamless 4K looping oscilloscope animation: fft spectrum bars on display. Glowing vector signal trace in teal and cyan on a dark graticule screen, with blank readout panels for your own labels. Horizo
00:07
Alta definición
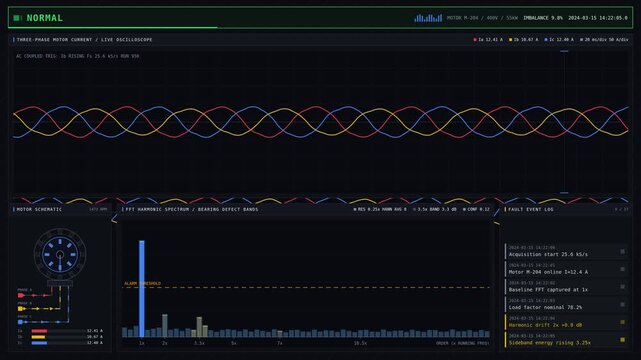
Sleek 4K dark motor current dashboard visualizing abnormal load and bearing problems with real-time waveform animation and fault log notifications for commercial creative technology and business use.
00:15
Alta definición
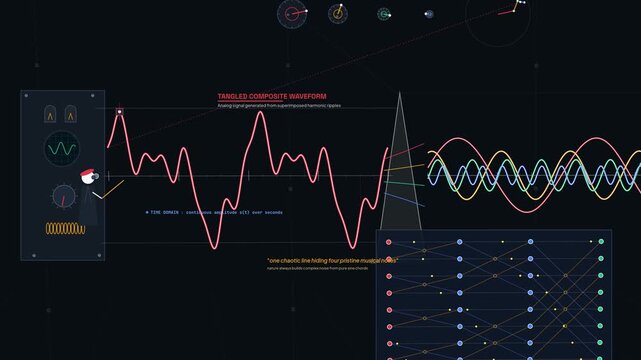
An animation illustrating the Fourier transform and FFT decomposition, showing a tangled composite waveform being separated into pure sine waves in the frequency and time domains
00:59
Alta definición
Digital Transformation - IoT Predictive Maintenance: Motor vibration trend smooths to flat; a wrench icon dissolves into a mint check as status toggles to normal.
00:07
Alta definición
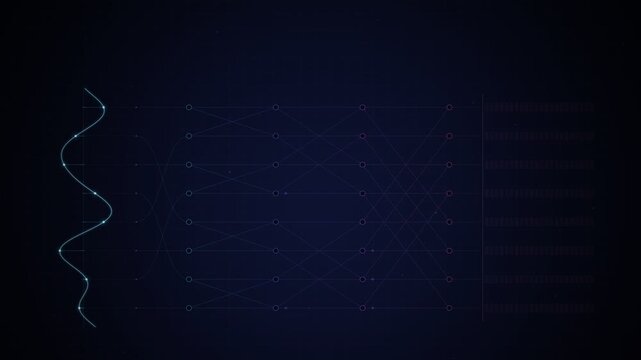
FFT Butterfly Signal Flow Diagram With Glowing Spectrum Seamless Loop
00:15
Alta definición
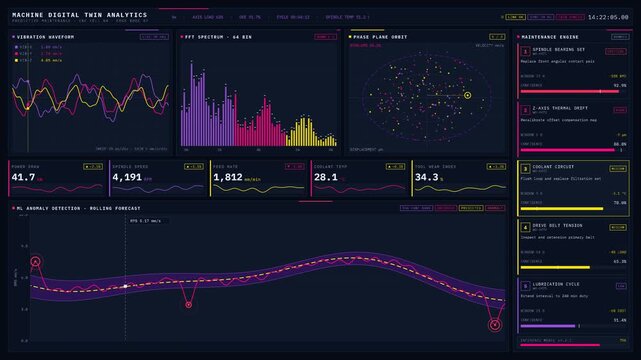
Explore a vibrant 4K analytics dashboard featuring machine performance metrics with a synthwave palette, showcasing real-time data visualizations and AI-driven insights.
00:15
Alta definición
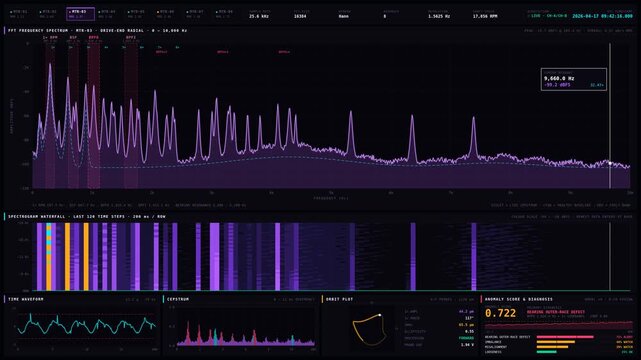
A detailed dark-mode vibration analysis dashboard for rotating equipment showcasing FFT spectrum, fault detection, and waterfall visualizations with animated data display.
00:15
Alta definición
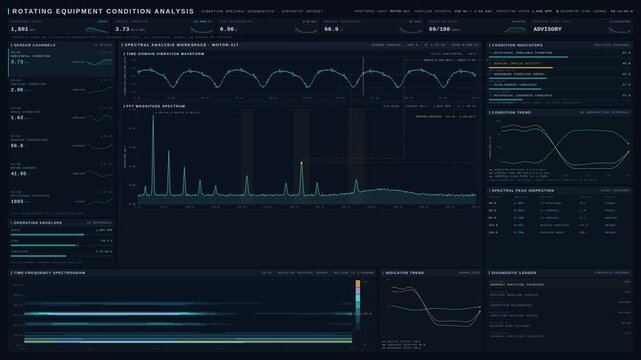
Sophisticated industrial machine condition dashboard featuring spectral analysis, vibration waveforms, FFT frequency domain monitoring, early fault indicators.
00:15
Alta definición
Scientific FFT Signal Spectrum Visualization
00:18
Alta definición
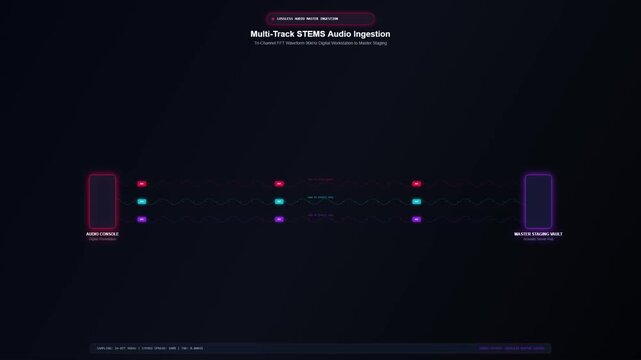
Multi Track Stems Audio Ingestion Animation Featuring Real Time FFT Waveform Visualization for Professional Music Production
00:08
Alta definición
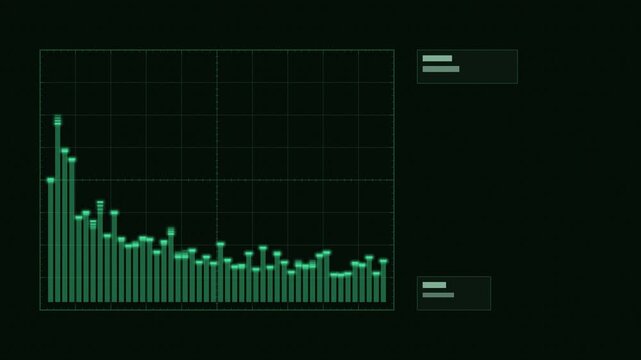
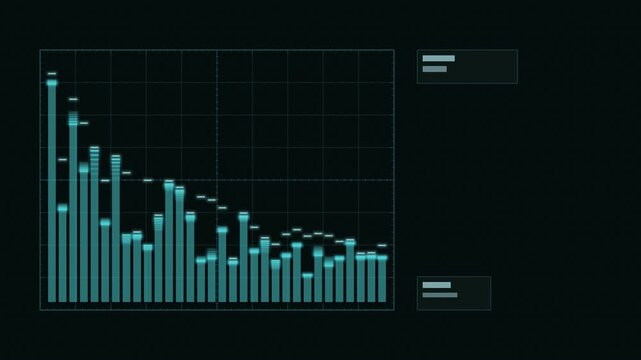
Animated fft bars dense resolution display drawn as a minimal lab instrument display in green and mint on a dark background. Smooth 4K seamless loop with phosphor glow, measurement grid and blank data
00:07
Alta definición
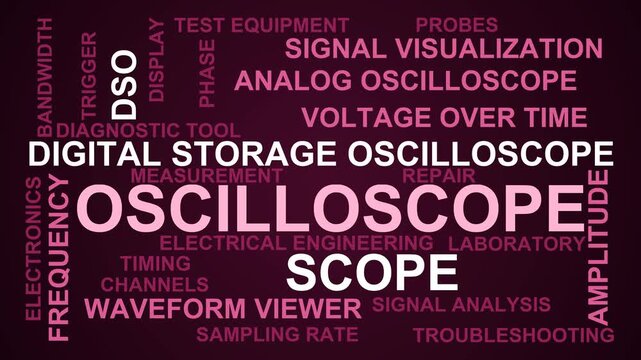
Oscilloscope Word Cloud
00:11
Alta definición
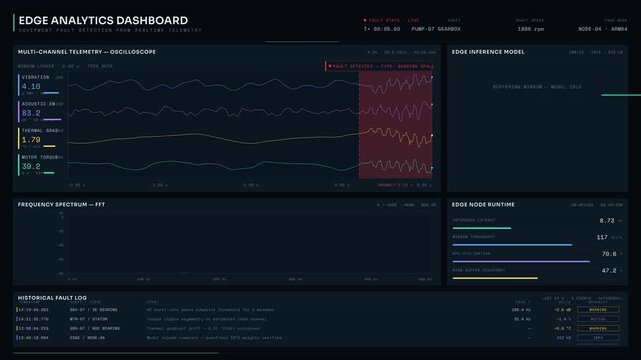
Edge Analytics Dashboard displaying real-time equipment fault detection with waveform visualizer and FFT analysis in a sleek dark interface for commercial creative technology and business use.
00:15
Alta definición
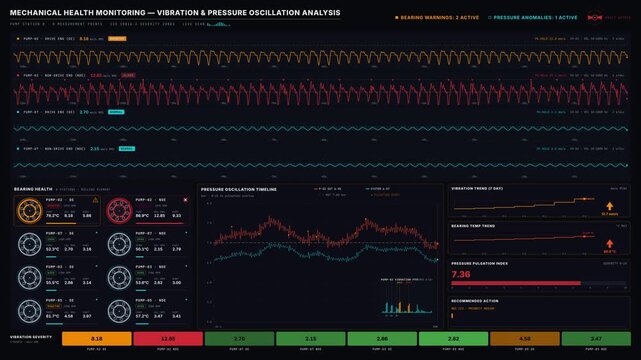
4K pump vibration monitoring dashboard with bearing warnings, pressure oscillation trends, and animated seismic waveform traces on dark aerospace console.
00:15
Alta definición
Scientific FFT Signal Spectrum Visualization
00:18
Alta definición
Seamless 4K looping oscilloscope animation: fft bars with peak hold. Glowing vector signal trace in teal and cyan on a dark graticule screen, with blank readout panels for your own labels. Horizontal
00:07
Alta definición
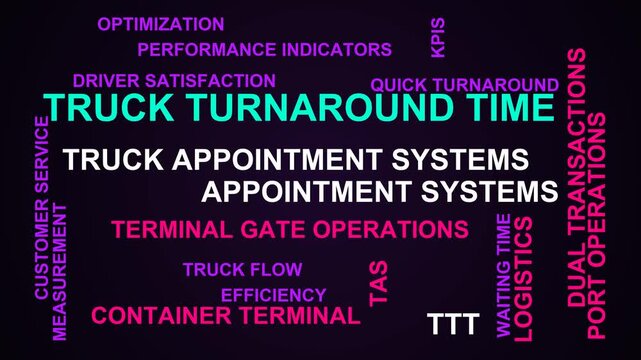
Truck Turnaround Time Word Cloud
00:11
Alta definición
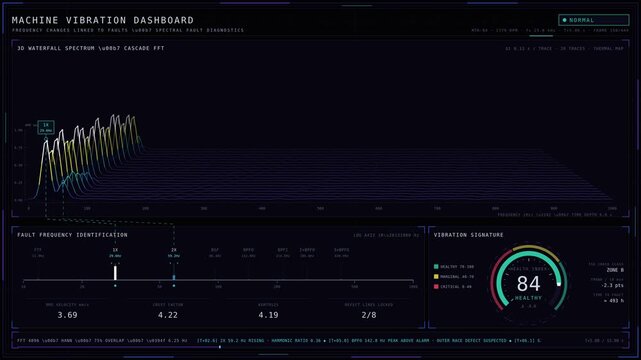
Explore a visually stunning 4K machine vibration dashboard showcasing frequency changes linked to faults with animated spectrum and health score gauge in a deep color palette.
00:15
Alta definición
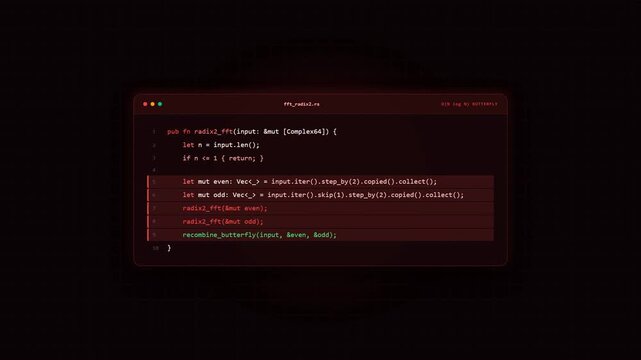
A video sequence showcasing a dark-themed code editor with Rust programming syntax. The screen displays the implementation of a Fast Fourier Transform function with distinct red highlights.
00:09
Alta definición
On audio cue HUD forming wireframe diamond pulsing labels and sparks, showing audio on transparent
00:12
Alta definición
Marine Sonar Monitoring System Showing Waveform and Spectrogram Data
00:12
Alta definición
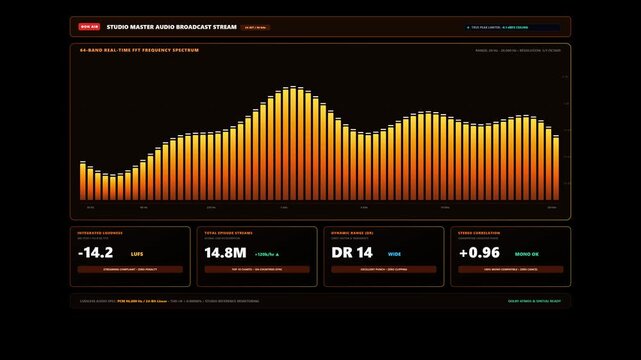
Professional Digital Audio Broadcast Stream Interface Featuring a Real-Time FFT Frequency Spectrum, Studio Master Level Meters, and Loudness Monitoring Dashboard for Music Production and Podcasting
00:08
Alta definición
Animated fft spectrum broad noise floor drawn as a minimal lab instrument display in green and mint on a dark background. Smooth 4K seamless loop with phosphor glow, measurement grid and blank data ca
00:07
Alta definición
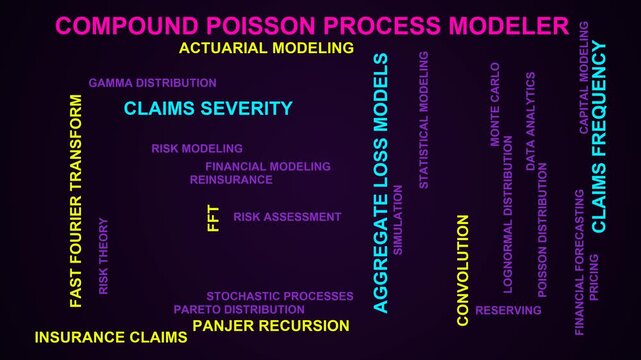
Compound Poisson Process Modeler Word Cloud
00:11
Alta definición
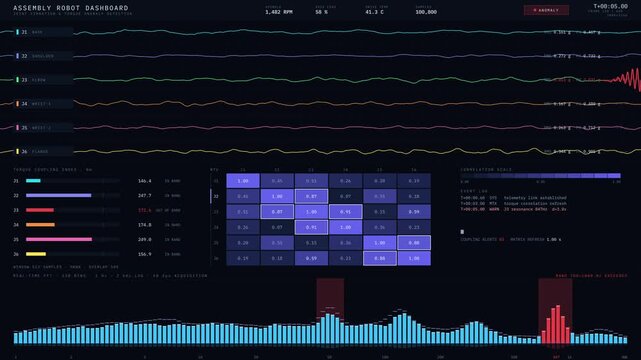
The advanced assembly robot dashboard showcases joint vibration and torque anomaly detection with dynamic visualizations and colorful waveform displays for real-time analysis.
00:15
Alta definición
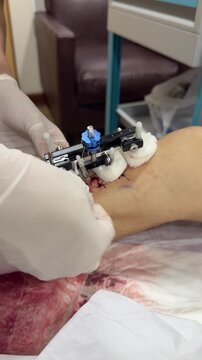
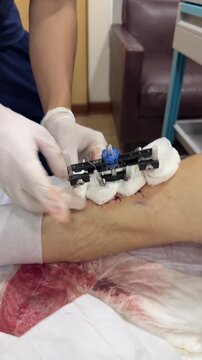
Medical professional applies bandages around a tibial transverse transport fixator after placement on the lower leg. Surgical dressing during treatment for diabetic foot.
00:25
Alta definición
HRV Frequency Domain Spectral Analyzer Dashboard Displaying Autonomic Nervous System Telemetry and Power Spectral Density PSD Oscilloscope Interface
00:18
Alta definición
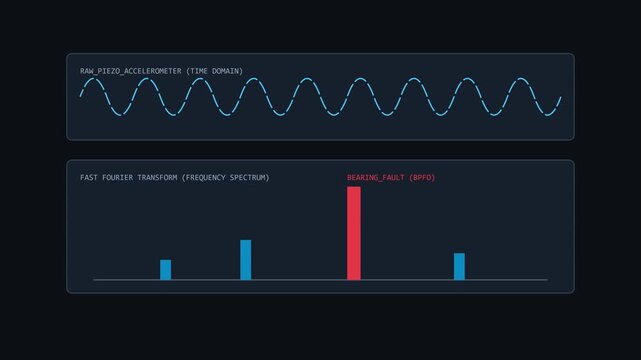
Industrial predictive maintenance dashboard: piezo accelerometer time domain and fast fourier transform bearing fault analysis animation 4k
00:10
Alta definición
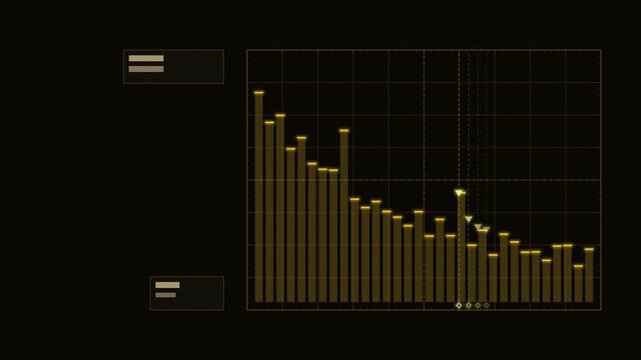
Animated spectrum analyzer with cursor line drawn as a minimal lab instrument display in yellow and amber on a dark background. Smooth 4K seamless loop with phosphor glow, measurement grid and blank d
00:07
Alta definición
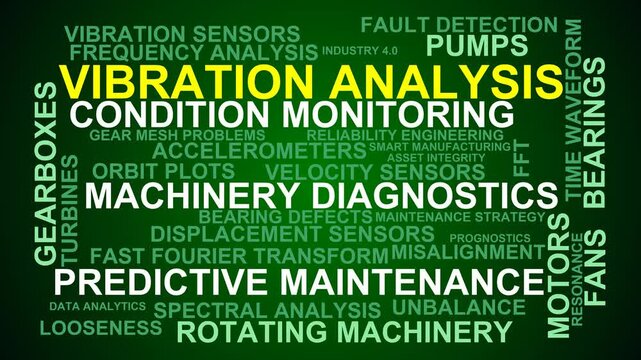
Vibration Analysis Word Cloud
00:11
Alta definición
Bandages are wrapped around a tibial transverse transport external fixator on a patient's lower leg after surgery for diabetic foot treatment.
00:32
Alta definición