Se ha enviado un vínculo para establecer tu contraseña a: Para acceder a tus compras en el futuro, necesitarás una contraseña.
Consigue 3 vídeos o 25 imágenes con una versión de prueba gratuita
Se han añadido nuevos filtros
Ordenar por

918 resultados para correlation en vídeos

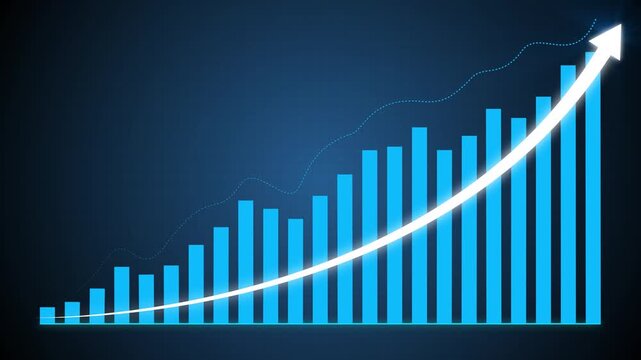
Business growth concept in allusive graph chart showing marketing sales profit increasing to target . Excellent financial status of corporate business rise up.4k animation video graph
00:10
Alta definición
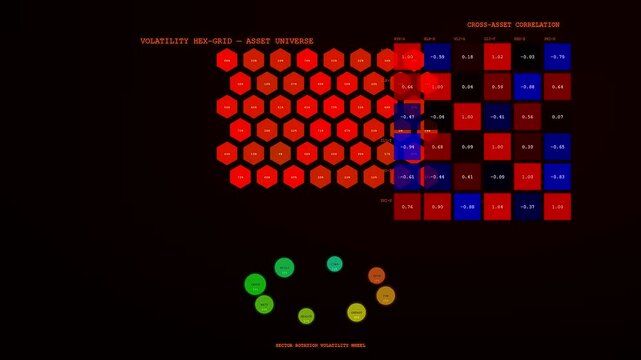
A digital market volatility index display showing red hexagons and a correlation matrix grid changing shapes in a dark environment with green circles appearing below
00:06
Alta definición
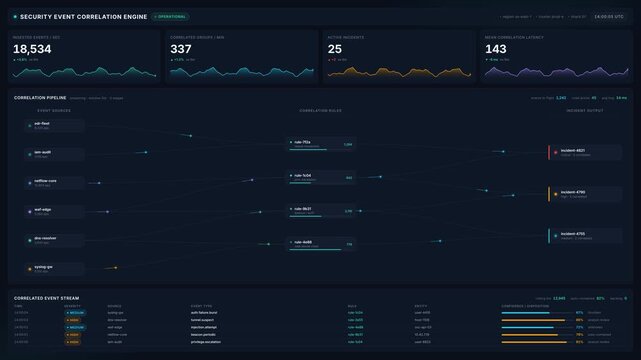
Security event correlation engine dashboard interface with live data streams incident alerts, for cyber threat monitoring, network security analysis, enterprise risk management
00:20
Alta definición
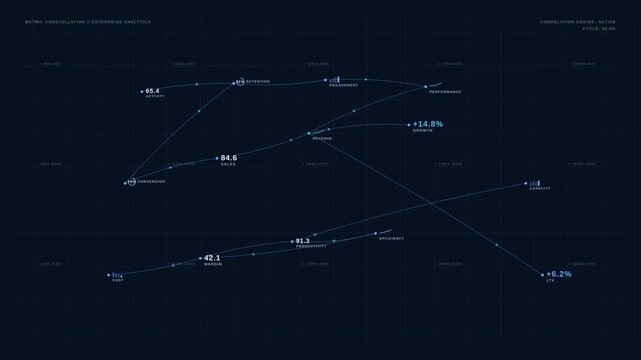
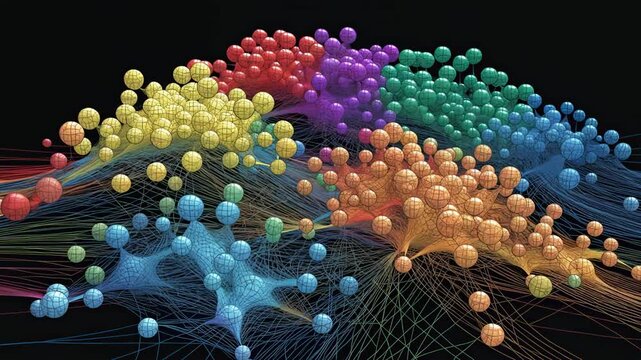
Metric Constellation Connected Business Signals
00:10
Alta definición
Scattered data point cluster rotating within a 3D wireframe grid space
00:10
Alta definición
Data Correlation Analysis and Multivariable Scatter Plot Clusters
00:10
Alta definición
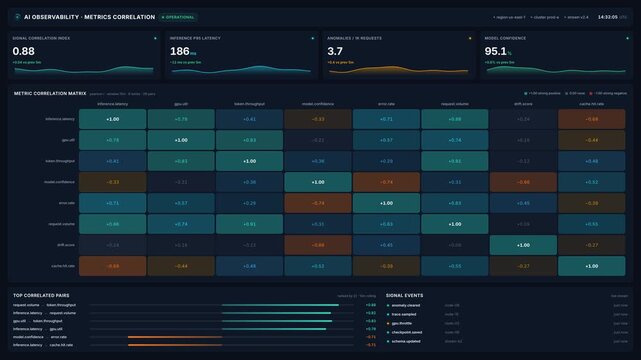
Ai observability dashboard with 4k animated metric correlation matrix heatmap, for real time performance monitoring, system reliability, data driven decision making for
00:20
Alta definición
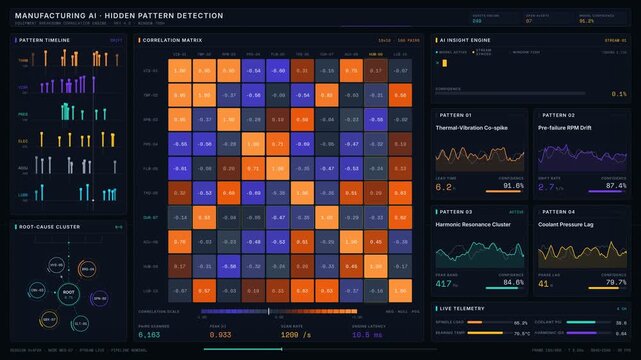
Explore a dark-mode manufacturing AI dashboard revealing hidden patterns behind equipment breakdowns with a dynamic correlation matrix and insightful data visualizations.
00:15
Alta definición
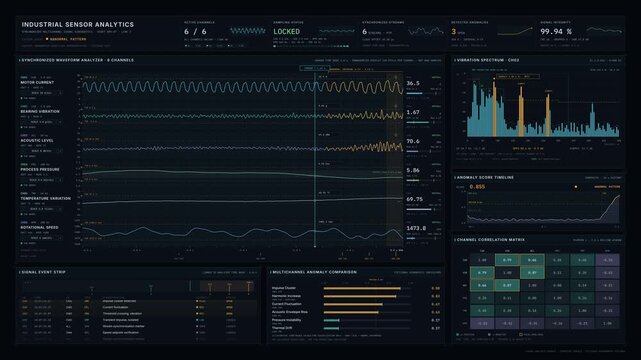
Premium industrial sensor analytics interface displaying synchronized multichannel waveforms, abnormal signal patterns, frequency spectra, and correlation matrices in a dark precision-instrument.
00:15
Alta definición
A scatter plot showing a negative correlation between two numerical variables
00:10
Alta definición
Advanced digital data visualization statistical charts futuristic analytics interface. market research, financial reports, enterprise dashboards, executive presentations, forecasting business strategy
00:19
Alta definición
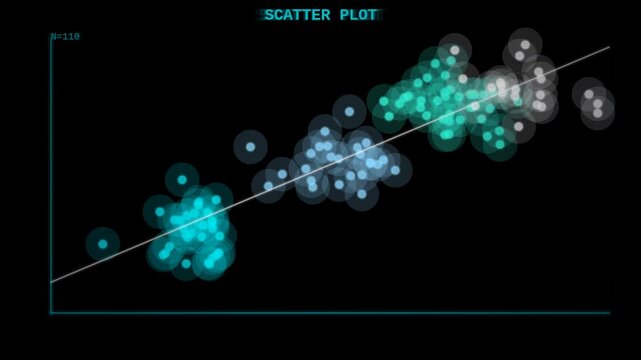
Scatter plot trend line HUD animated seamless loop alpha overlay with glowing data points and cyan neon correlation matrix
00:10
Alta definición
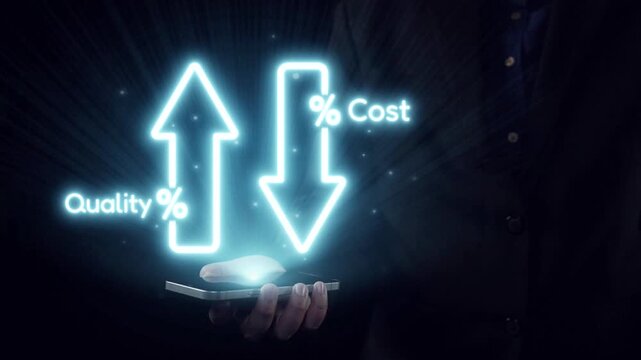
A dynamic image illustrating the correlation between increasing quality and decreasing costs in business. It showcases a glowing mouse held in hand, symbolizing technology-driven solutions. Qubit
00:14
Alta definición
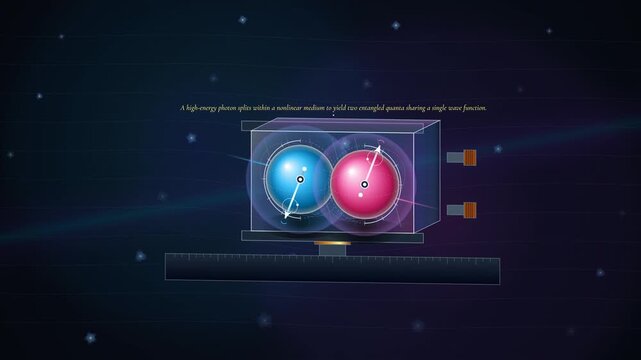
Educational animation visualizing the process of quantum entanglement, showing photon splitting, entangled quanta sharing a wave function, and nonlocal correlation across spatial separation
00:59
Alta definición
A person types on a keyboard. Forecasts, correlations and workload measurements provide complementary views of an AI system, linking analytical interpretation with computing activity.
00:12
Alta definición
Neural Imaging Waveforms: fNIRS vs. fMRI Correlation
00:05
Alta definición
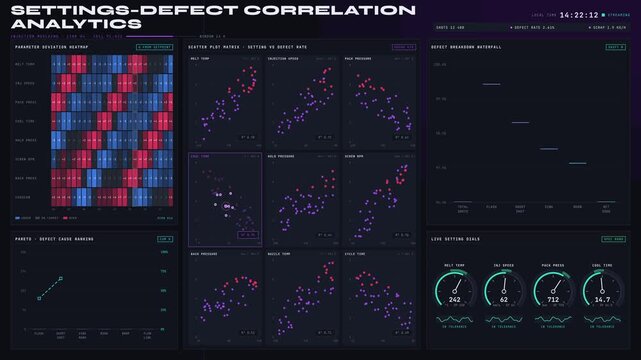
Explore the correlation between machine settings and defect rates in plastic production through a dynamic dashboard with various analytical charts and visualizations.
00:15
Alta definición
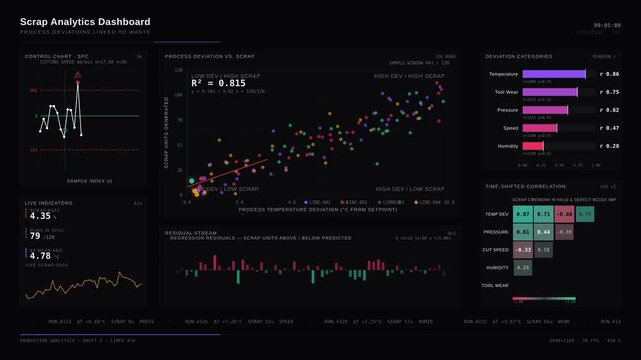
An advanced scrap analytics dashboard visualizing process deviations linked to waste through detailed scatter plots, control charts, and correlation matrices in vibrant colors.
00:15
Alta definición
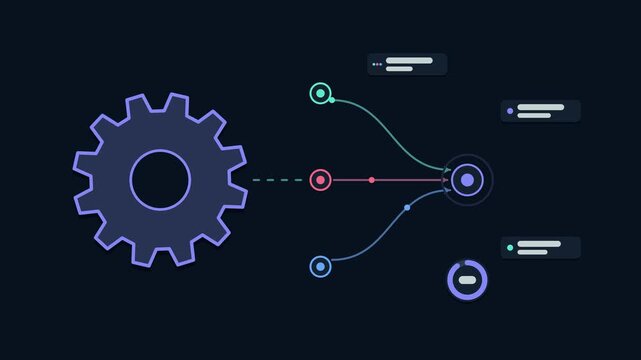
Animated threat correlation engine concept in a modern dark mode style, linking events in a smooth 4K seamless loop. Neon teal and turquoise accents, flowing dots and placeholder interface cards on a
00:07
Alta definición
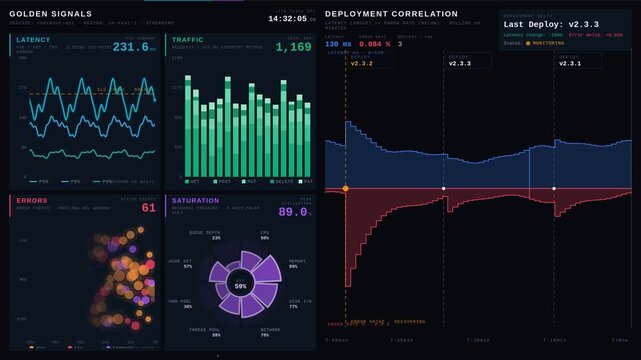
Explore a visually stunning real-time service performance dashboard designed in dark mode showcasing golden signals and deployment correlations with premium aesthetic appeal.
00:15
Alta definición
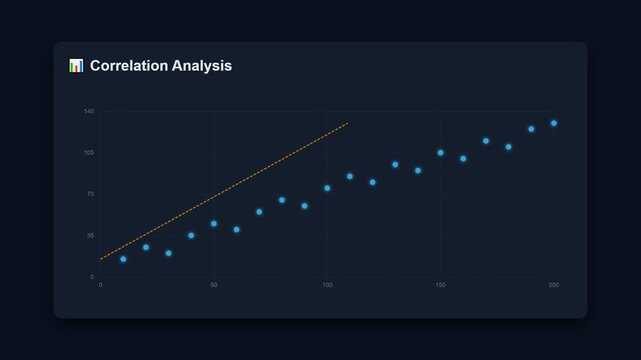
Correlation analysis scatter plot chart animation dark ui
00:10
Alta definición
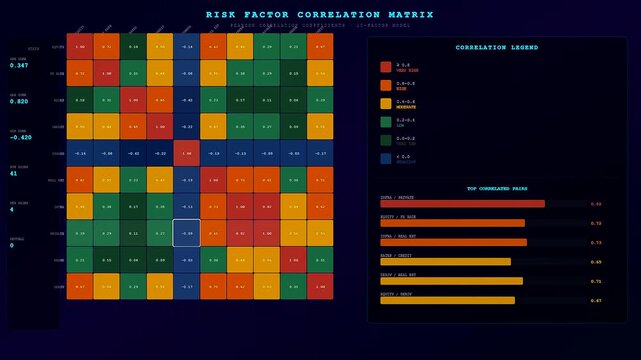
A quantitative risk assessment data visualization displays complex financial correlation metrics and color coded grids for analytical review inside a dark user interface dashboard software
00:06
Alta definición
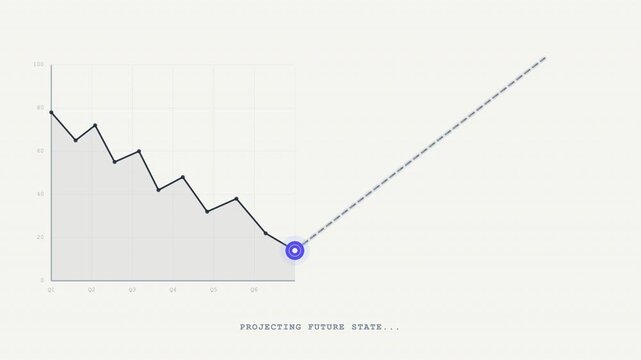
Animated Scatter Plot Showing Data Points Forming a Downward Curve on a Graph.
00:12
Alta definición
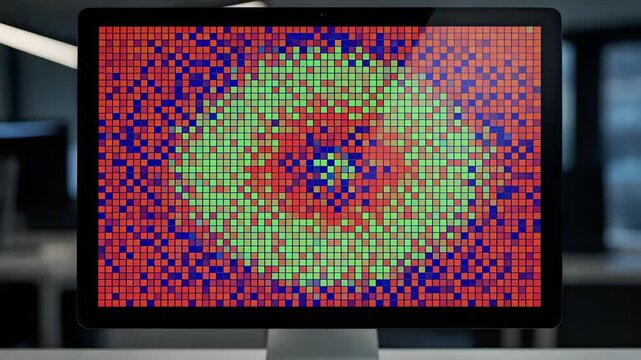
Medium shot of a colorful commodity price correlation matrix heatmap on a computer screen with sharp focus on a cluster of strongly correlated assets.
00:05
Alta definición
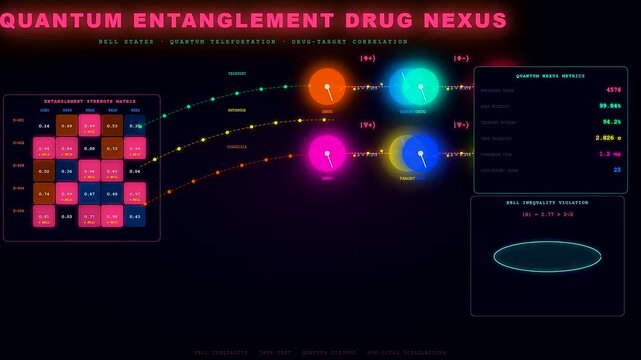
Futuristic Biotech Quantum Computing simulation displays complex entanglement and drug target correlations with vibrant neon glowing digital interfaces and data visualizations.
00:06
Alta definición
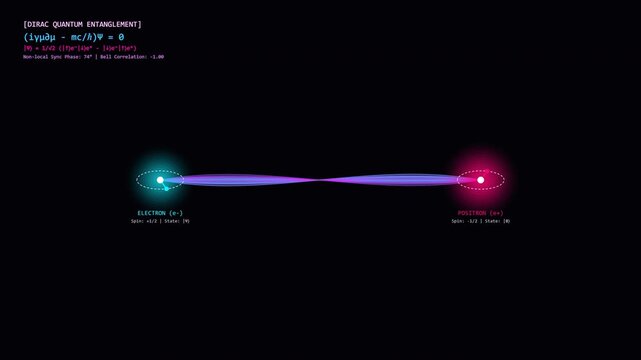
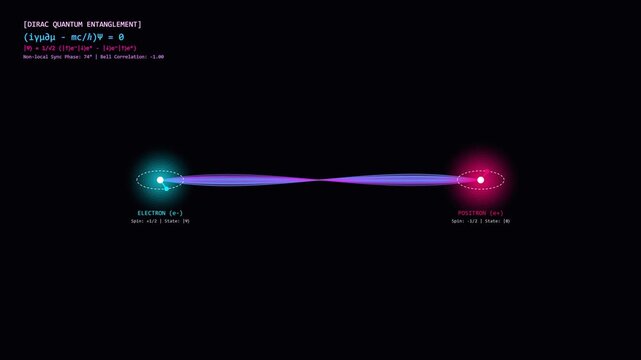
Electron Positron Quantum Entanglement Visualization with Dirac Equation and Bell Correlation
00:14
Alta definición
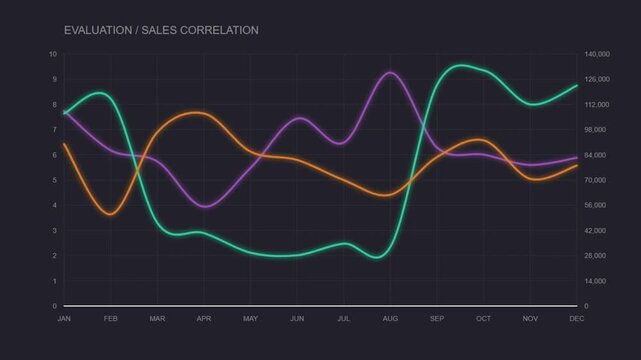
Dynamic Business Performance Chart Illustrating Evaluation and Sales Correlation Trends Over a Twelve-Month Period, Visualizing Key Metrics and Market Dynamics on a Dark Background
00:10
Alta definición
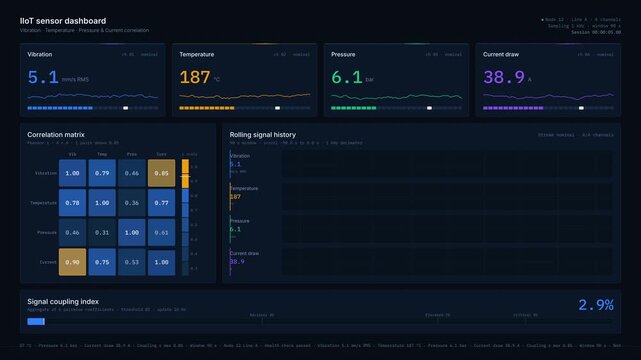
A dark-mode industrial IIoT sensor dashboard displays real-time data for vibration, temperature, pressure, and current correlation with animated visualizations and interactive elements.
00:15
Alta definición
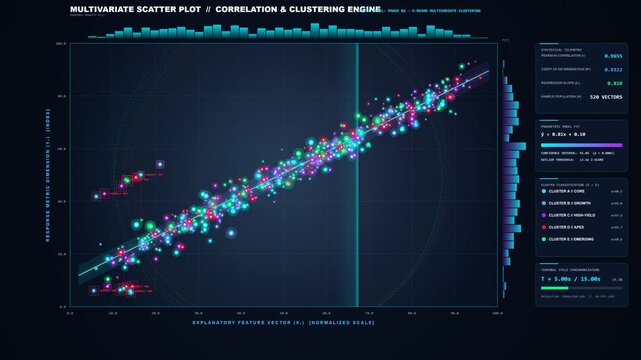
Multivariate scatter plot correlation and clustering engine analytical dashboard seamless loop animation
00:15
Alta definición
A scatter plot visualization displaying data correlation on a dark background
00:10
Alta definición
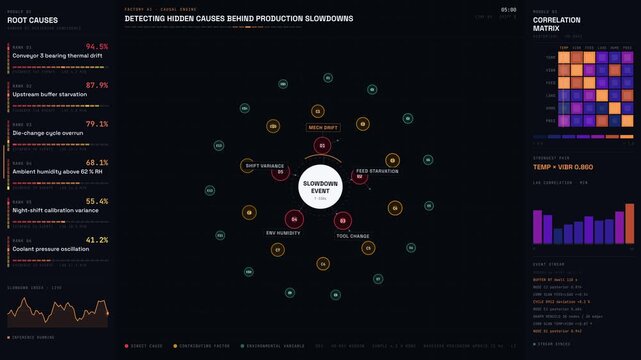
A sophisticated AI dashboard visualizes hidden production slowdown causes with a dynamic network graph and detailed correlation matrix in dark mode for advanced analysis.
00:15
Alta definición
Turquoise point-cloud wave reacting to data pulse, undulating and shifting dots to visualize trends
00:12
Alta definición
A creative representation of a robotic hand pointing at a rising graph, illustrating technological advancements in business analytics and future growth potential. Copula
00:10
Alta definición
Abstract bubble chart correlation glowing background seamless loop
00:10
Alta definición
A woman works on a laptop. Neural computing and predictive analysis share a workspace with training curves and comparison metrics, illustrating how AI models are monitored and assessed.
00:16
Alta definición
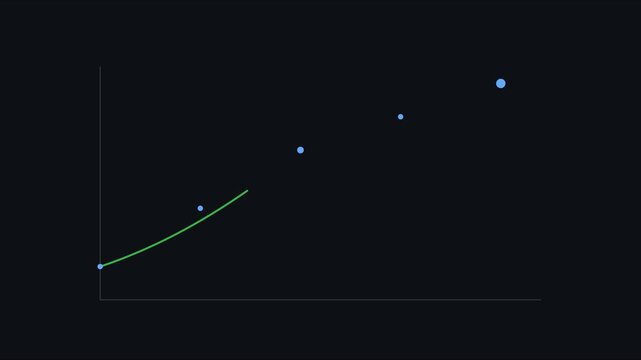
Dotted Scatter Plot Rising Along Trend Lines
00:08
Alta definición
Experience the dynamic energy of a dark-mode SOC Log Analytics interface showcasing hourly event spikes and critical correlations during a live cyber threat investigation.
00:15
Alta definición
Quantum Entanglement Visualized - A Journey into the Subatomic World.
00:08
Alta definición
Seamless 4K looping finance animation: rolling correlation grid smooth wave. Flat vector trading terminal with grid, axis ticks and blank readout cards in teal and cyan on a deep dark background, leav
00:07
Alta definición
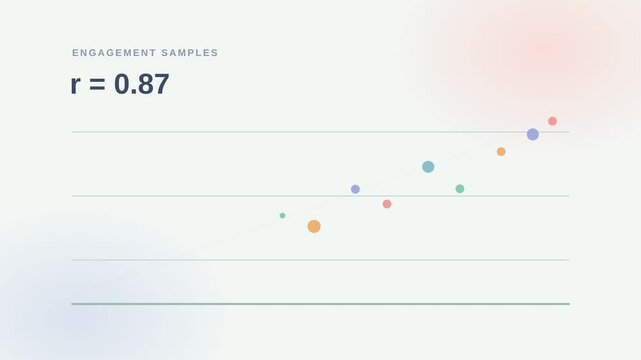
Dynamic motion of a scatter plot with a trend line illustrating high correlation in animated data visualization.
00:10
Alta definición
Data analysis software, statistical tools, research presentations. Visual representation of interconnected data points with adjustable correlation threshold.
00:10
Alta definición
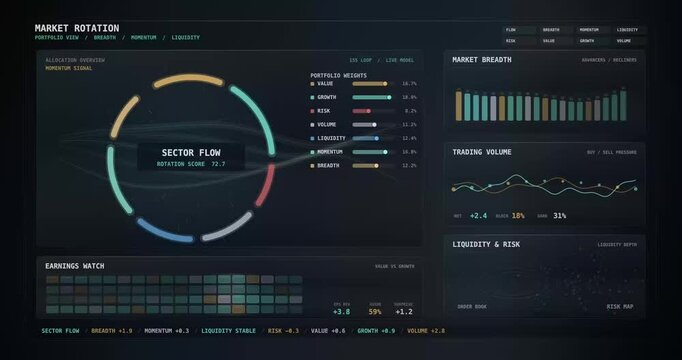
Loop Interactive Market Rotation Dashboard Showing Sector Flow
00:15
Alta definición
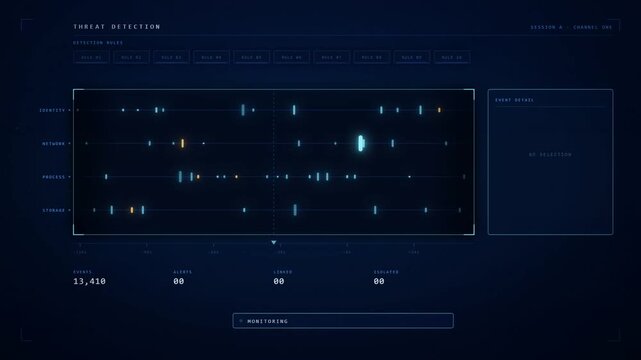
Cybersecurity threat detection dashboard animation with anomaly alert correlation and containment
00:20
Alta definición
Zoomedin medium shot highlighting detailed squares of a commodity correlation matrix glowing in bright colors with the rest blurred in the background.
00:05
Alta definición
 Event correlation HUD animated alpha overlay. Security logs and incident UI
00:10
Alta definición
Electron Positron Quantum Entanglement Visualization with Dirac Equation and Bell Correlation
00:14
Alta definición
Abstract Finance Correlation Matrix Wave Cascade Animation
00:06
Alta definición
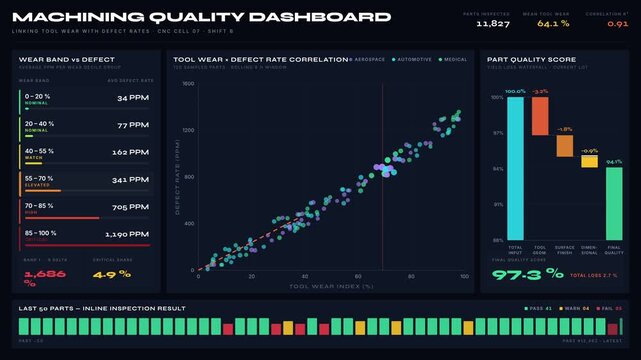
Analyze the Machining Quality Dashboard that links Tool Wear with Defect Rates using a dual-variable correlation chart and detailed data visualizations.
00:15
Alta definición
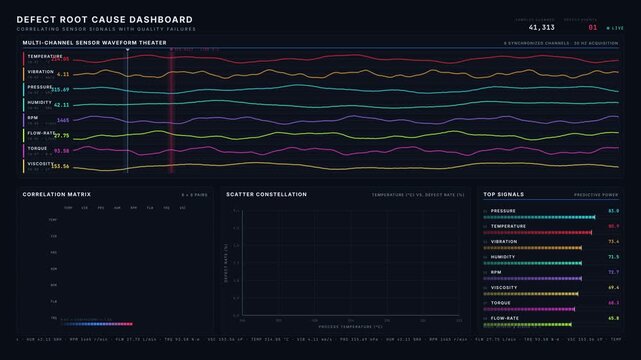
Explore a sophisticated defect root cause dashboard that correlates sensor signals with quality failures, showcasing dynamic waveforms and a correlation matrix in dark mode.
00:15
Alta definición
Quantum Electron Lattice Glowing with Strange Correlation Energy
00:05
Alta definición
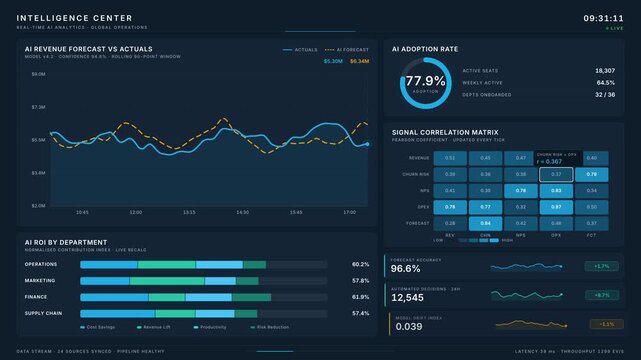
Premium 4K dark-mode AI business intelligence dashboard with live analytics, animated charts, and real-time data visualizations in an intelligent center interface.
00:15
Alta definición
Data Analytics Convergence Abstract Background
00:15
Alta definición
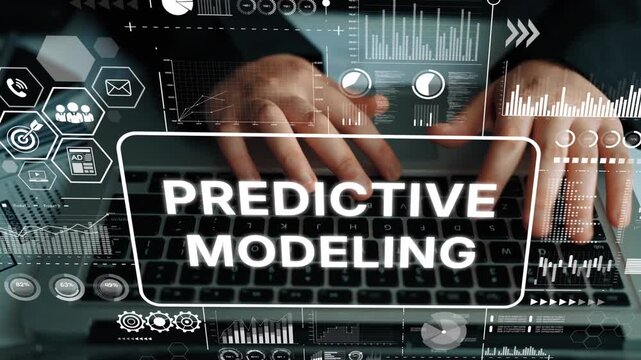
Modern Technology in Predictive Modeling with Hands on Laptop Surrounded by Data Visualizations and Graphical Elements. Asymptotic smart data analytic.
00:20
Alta definición
Correlation Strength Visualization: Animated Scatter Plot Dynamics
00:05
Alta definición
Hands type on a laptop. Prediction intervals, feature impact and ensemble weights reveal different aspects of AI analysis, supporting interpretation of model behavior and data trends.
00:12
Alta definición
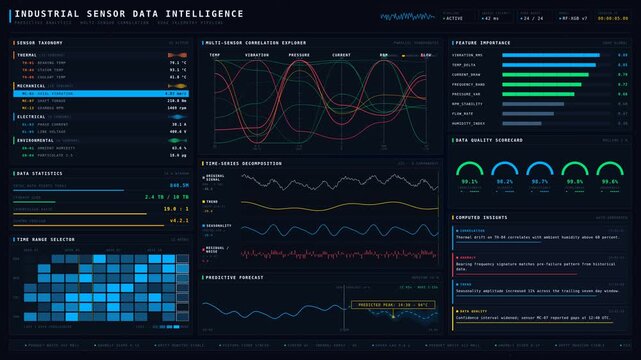
A visually engaging industrial sensor data intelligence platform showcasing real-time analytics, predictive forecasting, and multi-sensor correlation on a sleek digital interface.
00:15
Alta definición
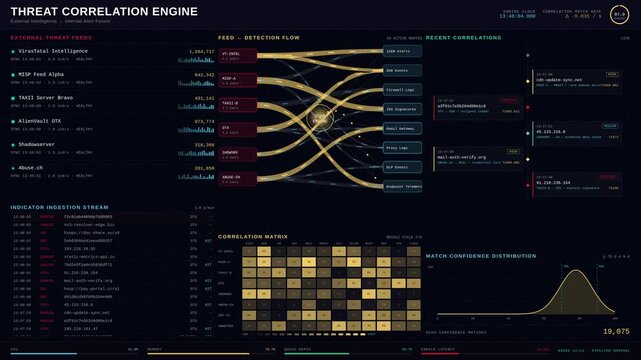
A sophisticated threat intelligence platform visualizes the correlation between external indicators and internal security alerts, showcasing live data analytics with vibrant colors and engaging.
00:15
Alta definición
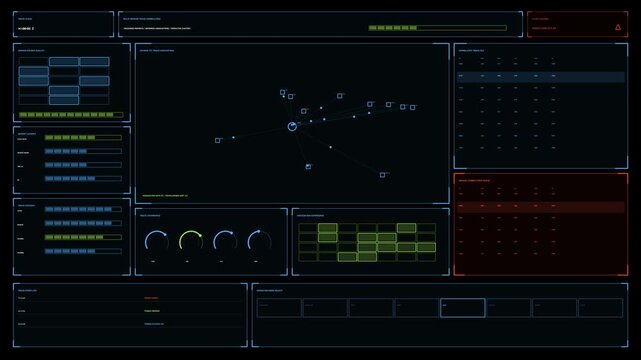
Military intelligence interface for defense explainer, showing a central multi sensor track correlation map, blue green monitoring panels and red alert queues. Animation loops seamlessly
00:30
Alta definición
Seamless 4K looping animation of a correlation matrix infographic template with cells highlighting. Flat vector shapes, icons and grey text placeholders animate on a clean light background in purple a
00:07
Alta definición
Quantum Entanglement Visualized - A Journey into the Subatomic World.
00:08
Alta definición
Three neon colored atomic models representing quantum cryptography displays moving across a dark digital interface to show data correlation and spinning orbits in synchronized patterns
00:06
Alta definición
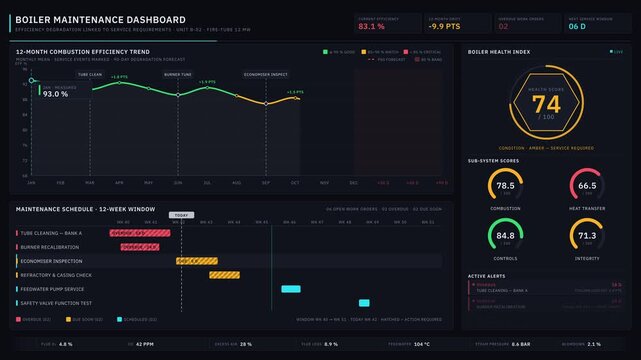
Explore the advanced boiler maintenance dashboard showcasing efficiency degradation linked to service requirements, featuring dynamic charts and predictive analytics in dark mode.
00:15
Alta definición
Digital data correlation scatter plot with glowing points
00:10
Alta definición
Zoomedin medium shot highlighting detailed squares of a commodity correlation matrix glowing in bright colors with the rest blurred in the background.
00:07
Alta definición
Grey and white neural layers on a dark field. Statistical modelling, regression analysis and data science
00:10
Alta definición
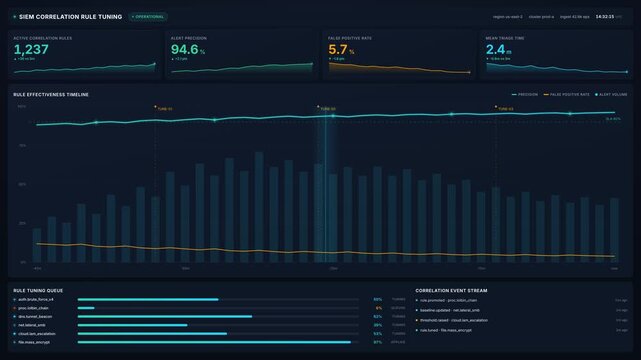
Security analyst reviewing 4k siem correlation rule tuning dashboard with live alert metrics, for cyber threat detection, data security, risk management
00:20
Alta definición
Analysis pattern detection HUD with glowing green scattered particle
00:08
Alta definición
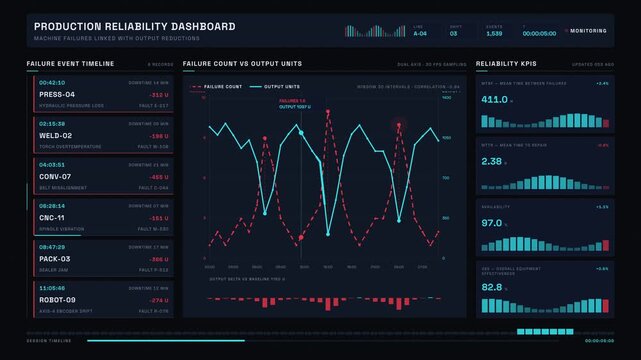
Production reliability dashboard visualizing machine failures and their impact on output reductions with animated graphs and KPI tiles in a sleek modern design.
00:15
Alta definición
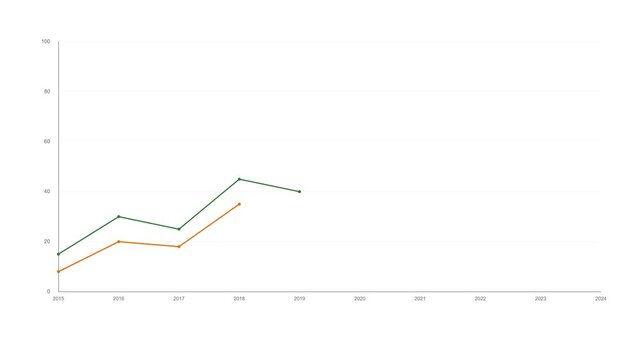
Comparative dual-line chart showing yearly financial value trends, business analytics style
00:15
Alta definición
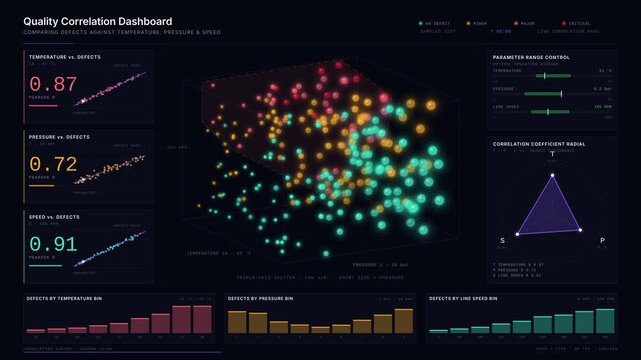
Explore a comprehensive Quality Correlation Dashboard showcasing defects against temperature, pressure, and speed with stunning 3D scatter plots and vibrant color coding.
00:15
Alta definición
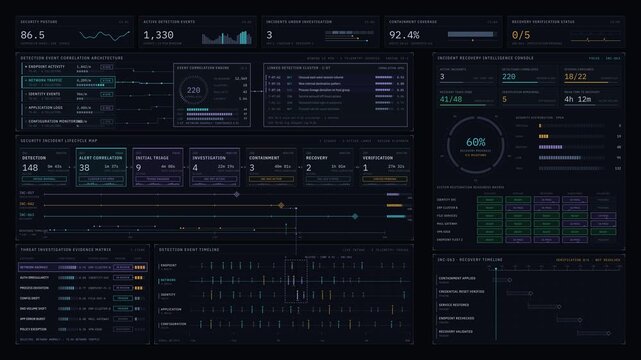
Sophisticated cybersecurity SOC dashboard animation tracking incident lifecycle stages from detection to recovery with correlated telemetry data and status indicators.
00:15
Alta definición
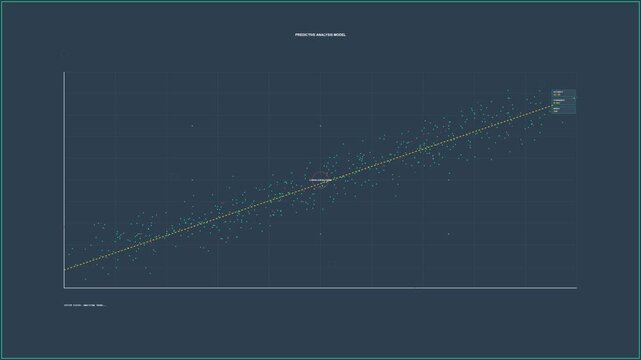
Predictive Analytics Scatter Plot Regression Analysis Motion Graphic
00:10
Alta definición
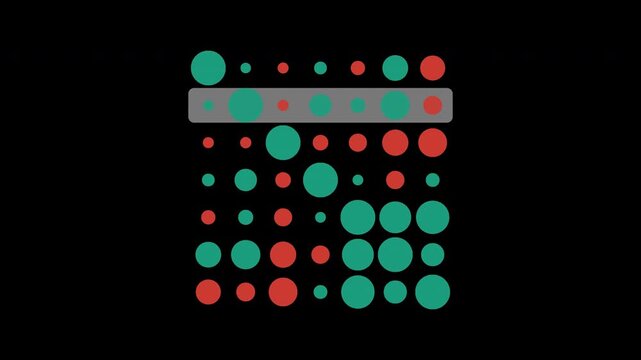
Animated correlation matrix of bubbles with alpha channel
00:10
Alta definición
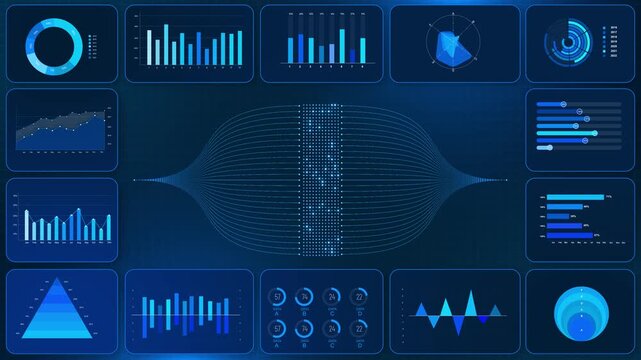
Correlation engine digital blueprint featuring data processing nodes and information flow architecture for artificial intelligence systems and machine learning analytics on blue tech background
00:08
Alta definición
AI specialist works at a keyboard. Forecasts, correlations and workload measurements provide complementary views of an AI system, linking analytical interpretation with computing activity.
00:10
Alta definición
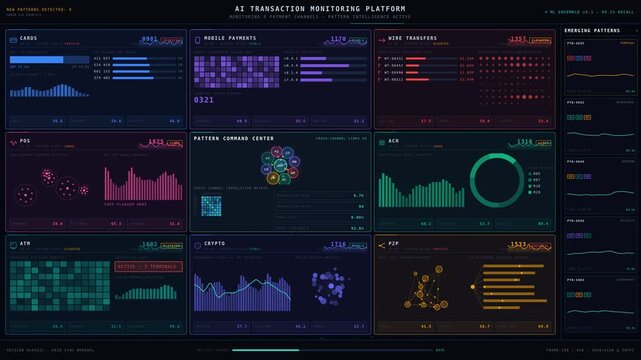
Explore the advanced AI transaction monitoring platform visualizing emerging fraud patterns across diverse payment channels with a sleek, multi-channel intelligence layout.
00:15
Alta definición
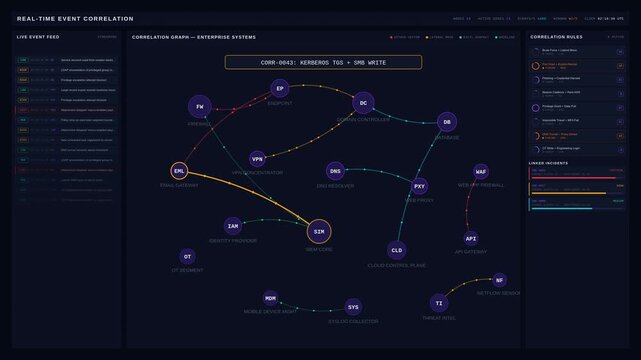
Cinematic 4K real-time event correlation dashboard showing suspicious activity connections across enterprise security systems with animated node graph.
00:15
Alta definición
Scattered points collapsing onto a clean trend line, loop
00:10
Alta definición
Scatterplot displays data points, histogram shows distribution. Blue tones dominate, creating abstract visualization.
00:07
Alta definición
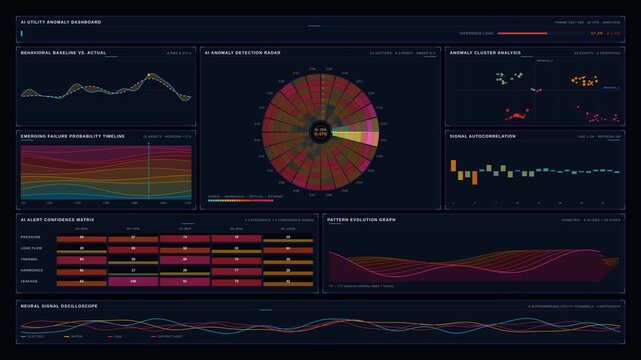
Explore an AI Utility Anomaly Dashboard showcasing unusual network behavior and emerging failure detection with vibrant colors and immersive cybernetic design in 4K resolution.
00:15
Alta definición
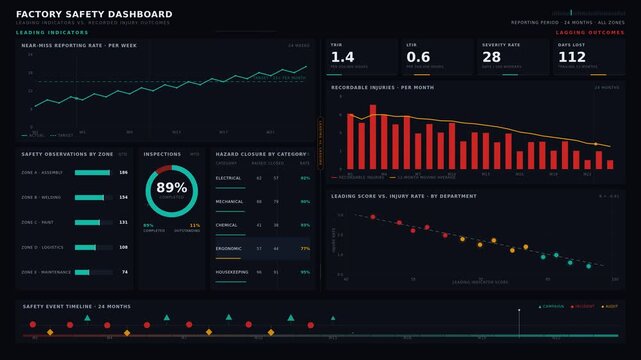
Explore a factory safety dashboard that visually contrasts leading indicators with recorded injury outcomes, featuring detailed charts and KPIs in a dark mode interface.
00:15
Alta definición
Data regression analysis chart showing trend line fitting over scatter plot points for statistical modeling and financial forecasting
00:10
Alta definición
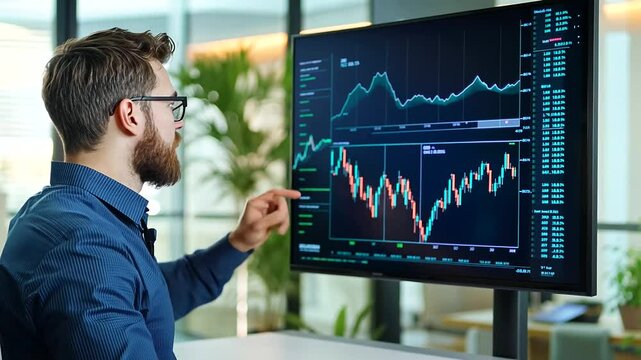
Cryptocurrency Market Correlations Presented to Executives in Office
00:10
Alta definición
Focused view of a vibrant heatmap displaying diverse commodity correlations capturing the intensity of price relationship patterns on a digital monitor.
00:05
Alta definición
Deep blue data points fading into the dark. Data mining, pattern discovery and statistical modelling background
00:10
Alta definición
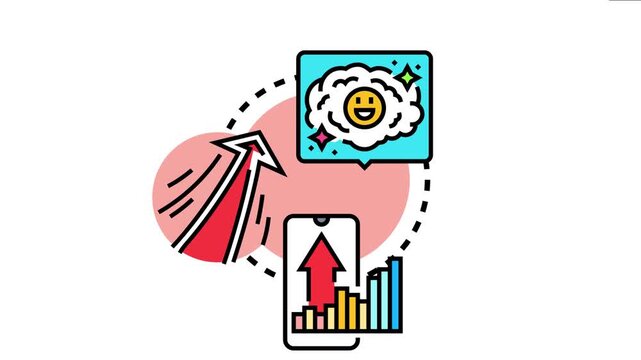
Visualizing positive correlation concepts with upward trends, smart phone data display, rising arrow, and a thought bubble showing a smiling face
00:17
Alta definición
An abstract digital representation showcasing interconnected padlocks on a blue network. This image symbolizes cybersecurity, data protection, and technological security solutions.

00:05
Alta definición
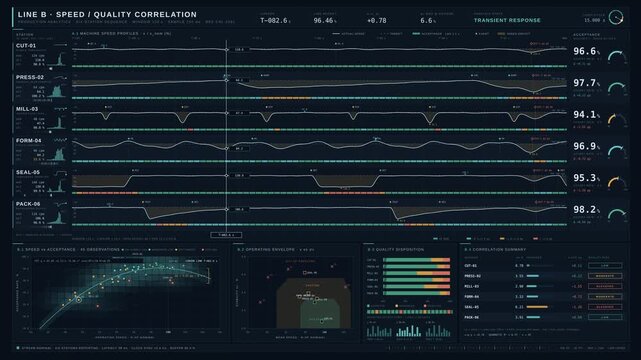
4K production line dashboard comparing machine speeds and quality acceptance rates with waveforms and scatter plots in dark blue interface for commercial creative technology and business use.
00:15
Alta definición
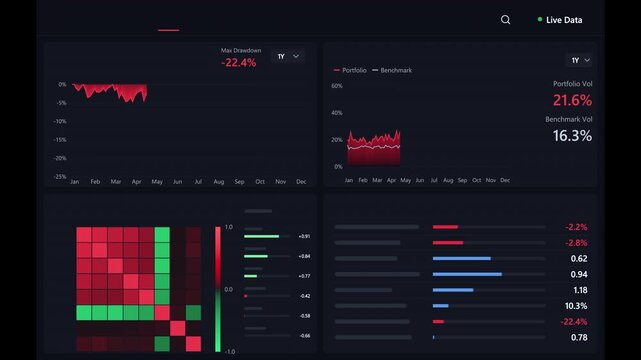
Fading in dashboard UI displaying drawdown -22
00:10
Alta definición
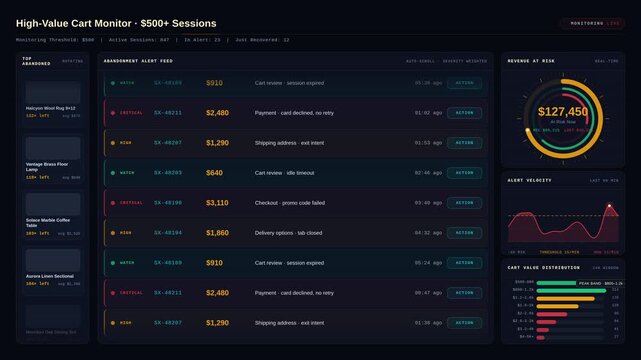
Explore a detailed shopping cart analytics dashboard that compares product discounts and abandonment patterns with vibrant color coding and data visualizations for insights.
00:15
Alta definición
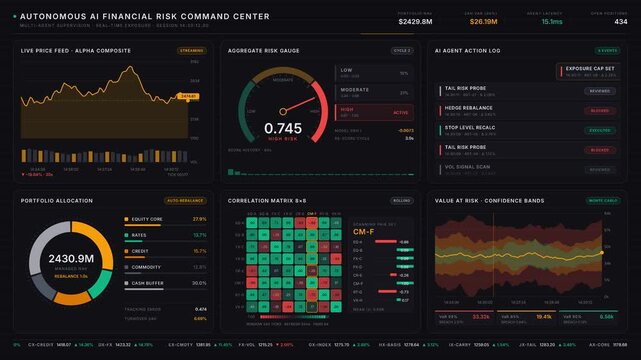
Explore a sophisticated 4K AI-driven financial risk command center featuring a premium charcoal-and-gold aesthetic with real-time data visualizations and dynamic charts.
00:15
Alta definición
Dynamic display illustrates the analysis of complex data sets, highlighting trends and correlations with vivid colors and elegant lines
00:10
Alta definición
A detailed view of a bar chart displayed on a computer screen, showcasing data and trends, A scatter plot showing the correlation between market volatility and trade volume
00:10
Alta definición
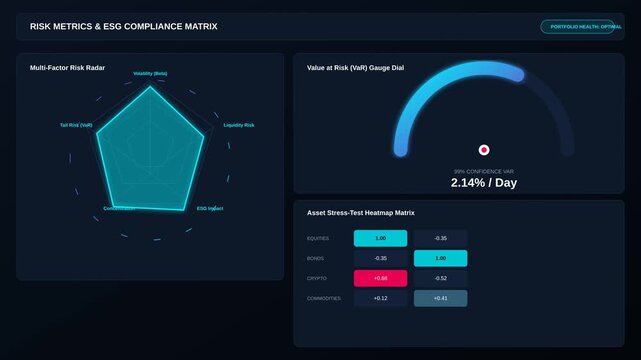
Digital Dashboard Displaying Risk Metrics and Financial Compliance Data Analysis for Investment Fund
00:10
Alta definición
Hands type on a keyboard. Forecasts, correlations and workload measurements provide complementary views of an AI system, linking analytical interpretation with computing activity.
00:10
Alta definición
Abstract scatter plot graphic representing data analysis and growth.
00:05
Alta definición
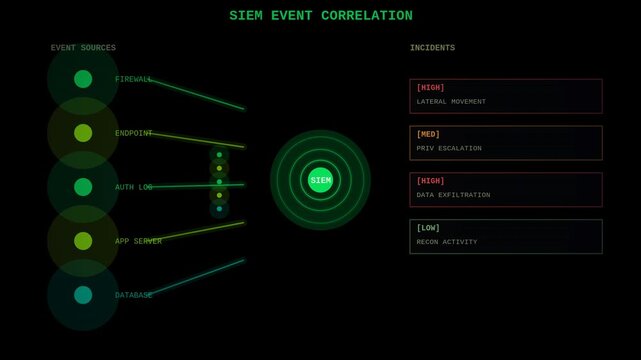
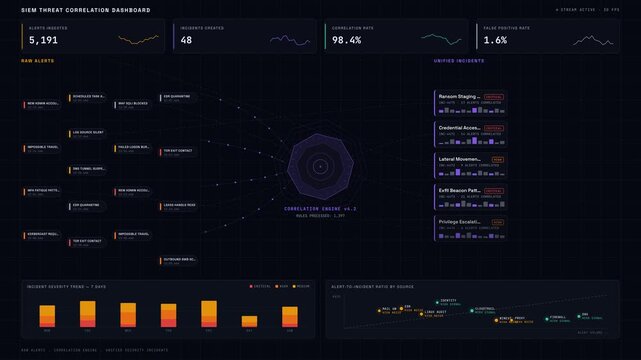
Experience a premium 4K dark-mode animation visualizing the SIEM threat correlation process, transforming raw alerts into unified security incidents with dynamic visual elements.
00:15
Alta definición
The line graph clearly illustrates the increase in sales over the past five years, showing trends.
00:06
Alta definición
Clean animated correlation matrix cells highlighting in yellow and gold on a bright white background. Seamless looping 4K dashboard motion graphics with free space for text, ideal for business present
00:07
Alta definición
Glowing neon magnifying search icon on glowing neon business graphs and financial growth and profit through data analysis and graph sign animation
00:10
Alta definición