Se ha enviado un vínculo para establecer tu contraseña a: Para acceder a tus compras en el futuro, necesitarás una contraseña.
Consigue 3 vídeos o 25 imágenes con una versión de prueba gratuita
Se han añadido nuevos filtros
Ordenar por

278 resultados para chart data simple user en vídeos

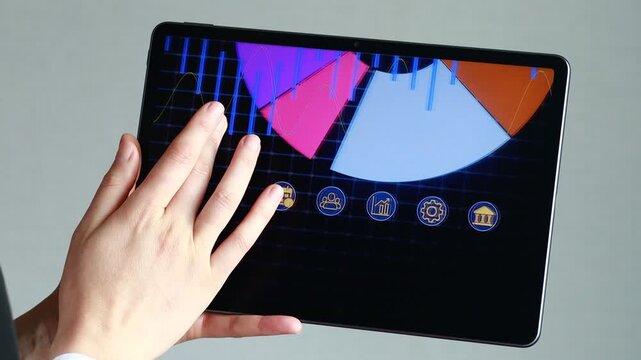
A person is using a tablet to view stock market charts. The screen shows various graph lines and bars in bright colors. The setting has a simple background.
00:11
Alta definición
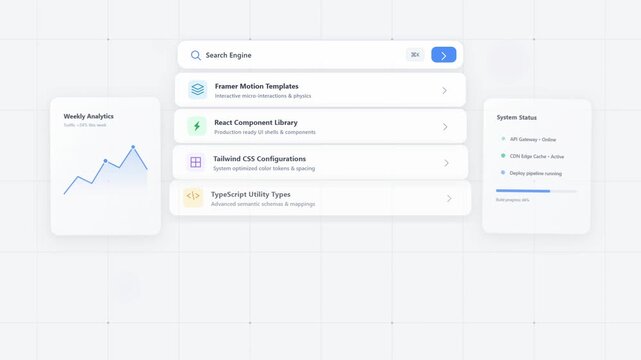
Minimalist digital user interface with search engine bar data analytics charts and system status dashboard on white grid
00:07
Alta definición
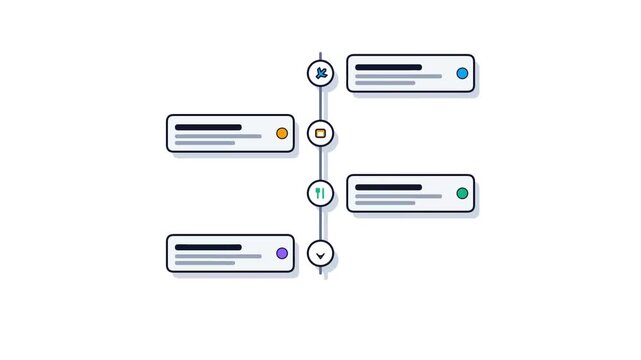
A visual representation of a timeline with connected information cards.
00:10
Alta definición
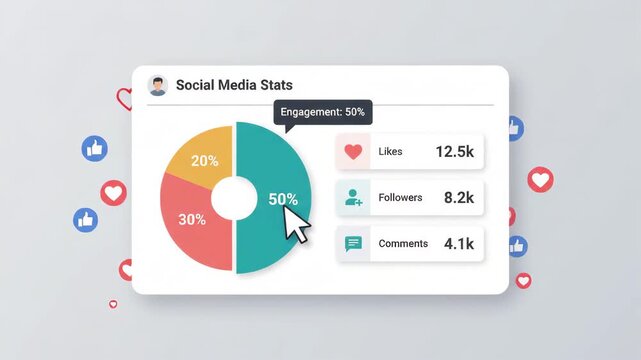
digital social media statistics dashboard displays colorful donut chart engagement data follower counts likes and comments on minimalist neutral light grey background interface design
00:06
Alta definición
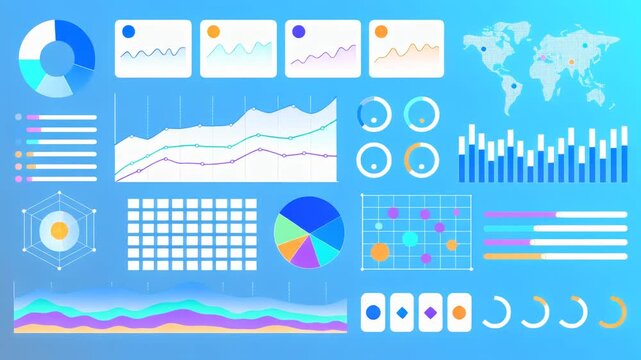
Colorful business data visualization with charts graphs and world map for analytics and statistics
00:05
Alta definición
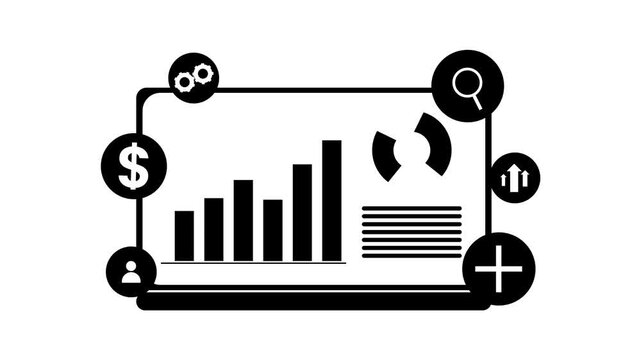
Minimalist Business Analytics Dashboard on Laptop Screen Silhouette Motion Graphic Element
00:08
Alta definición
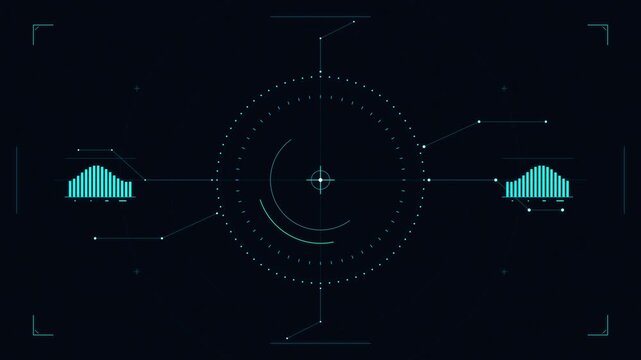
Digital HUD animation dot circle data graph bars connection line dark background grain processed
00:06
Alta definición
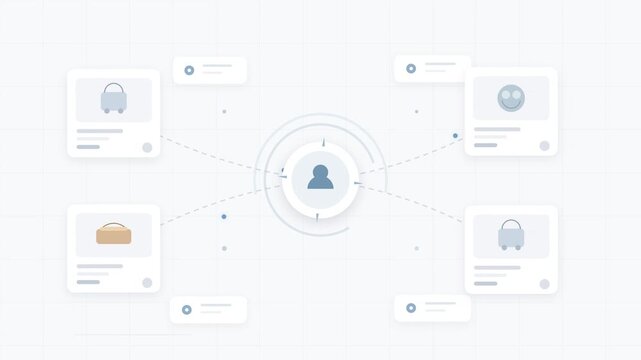
User profile connection dashboard with flat interface animation
00:05
Alta definición
Laptop screen displaying growth chart and user icon, simple line art.
00:08
Alta definición
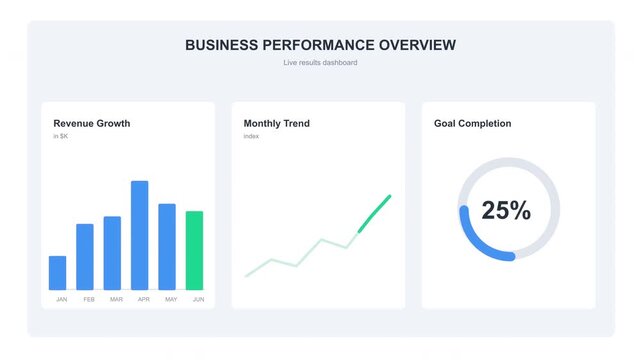
Business performance overview graphs charts data web page popup presentation
00:06
Alta definición
Real-time data analytics dashboard displaying performance charts and user interface elements for business intelligence
00:10
Alta definición
Business dashboard interface with data charts and timeline
00:15
Alta definición
Software dashboard interface with data analytics and progress bars
00:10
Alta definición
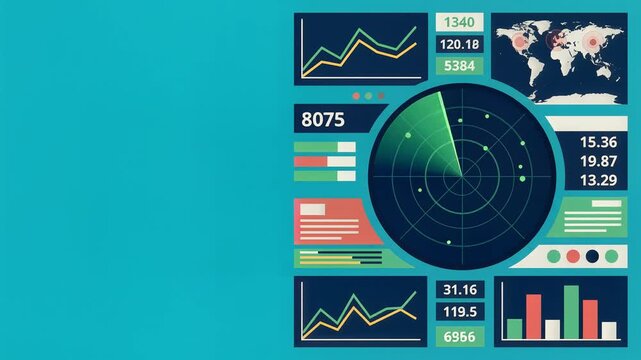
Digital Dashboard Interface with Radar Scan and Data Visualization Graphics
00:10
Alta definición
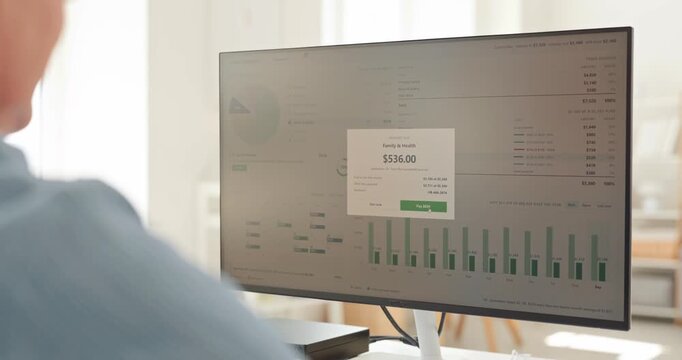
Man completes payment for household bill online. Footage shows a budget dashboard as payment confirmation appears, showing expense tracking. Household finance management made simple today.
00:09
Alta definición
Computer screen ui wireframe icons with data dashboard elements
00:15
Alta definición
Data Visualization Dashboard Displaying Interactive Graphs and Analytics Interface in a Modern Digital Environment
00:08
Alta definición
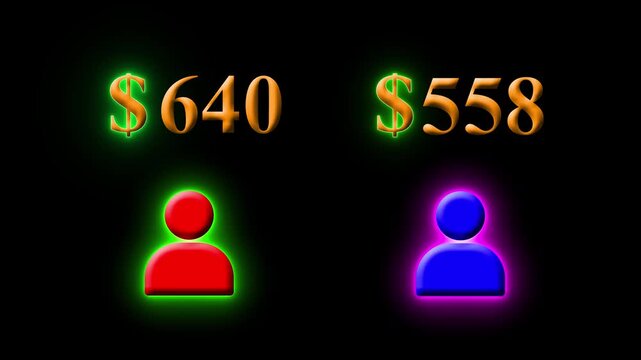
 Financial Choice Concept, Business Decision and Modern Graphic 4k animation. Neon $730 vs $830 Price Comparison Animated with Glowing User Silhouettes, Dual Cost Display, Digital Pricing Analysis.
00:10
Alta definición
Animated Graphic Elements User Profile Heart Data Charts and Countdown Timer
00:05
Alta definición
User interface data dashboard animation with line charts
00:05
Alta definición
Team Productivity Dashboard Interface Showing Progress Bars Rising with User Profile Icons on White Background
00:10
Alta definición
Simple upward pointing arrow icons set on black background
00:12
Alta definición
Abstract representation of a user interface card with colored bars and dots.
00:15
Alta definición
Circle Loading animation from 0 to 100 with transparent background. Abstract circle frame loading icon animation, Modern User Interface Design Concept,
00:10
Alta definición
Colorful minimalist digital data dashboard interface with vibrant neon flat design elements and graphs
00:15
Alta definición
tablet displays digital line graph tracking data fluctuations presented with clean user interface design against solid neutral gray background
00:06
Alta definición
Customer satisfaction icons showing positive and negative feedback trends
00:06
Alta definición
Minimalist digital user interface dashboard with abstract data visualization graph and connected points on a clean white background. Modern web design and software analytics concept for technology.
00:10
Alta definición
Neon green thermometer icon showing weather temperature level with red markings isolated on a black background for medical and climate science digital user interface design graphic elements.
00:10
Alta definición
Business analytics dashboard data charts modern minimalist flat ui design financial reporting information graphic interface
00:10
Alta definición
Minimalist data analytics dashboard animation with business charts
00:10
Alta definición
A dark mode histogram titled "User control Analysis" displays a distribution of data with various grey bars on a stark black background.
00:08
Alta definición
Minimalist business dashboard and digital workspace interface
00:15
Alta definición
Glass Profile Card Growing with Data Elements in Digital Interface Animation
00:08
Alta definición
Data Dashboard User Interface Motion Graphics Animation Sequence
00:10
Alta definición
Dashboard interface menu showing user behavior analytics data panel with simple UI design
00:08
Alta definición
Animated Business Data Dashboard Interface with Progress Bars and Circular Chart
00:10
Alta definición
 Financial Choice Concept, Business Decision and Modern Graphic 4k animation. Neon $710 vs $810 Price Comparison Animated with Glowing User Silhouettes, Dual Cost Display, Digital Pricing Analysis.
00:10
Alta definición
Pixelated interface screen displayed on tablet device, finger interacting with digital graph and data, technology concept.
00:06
Alta definición
Minimalist user interface wireframe with moving data elements
00:15
Alta definición
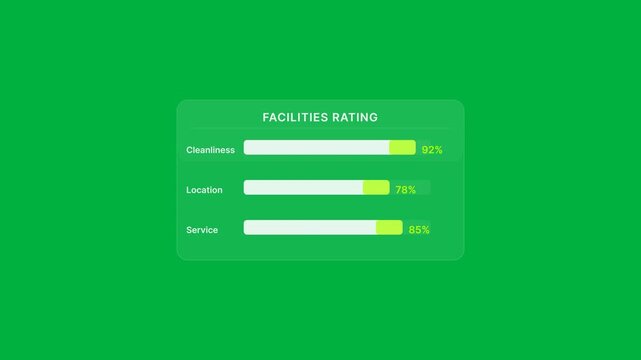
Facility rating interface showing progress bars for performance analytics and data evaluation
00:15
Alta definición
Minimalist colorful progress bars with various indicators on dark backdrop
00:10
Alta definición
A web browser displaying a user interface with data, progress bars, and a green checkmark indicating completion.
00:10
Alta definición
White line of a person standing above a medium engagement level progress bar on a black background
00:10
Alta definición
Horizontal progress bar with colorful segmented sections for loading process, data measurement, step completion, workflow status, and graphic timeline elements on transparent background
00:05
Alta definición
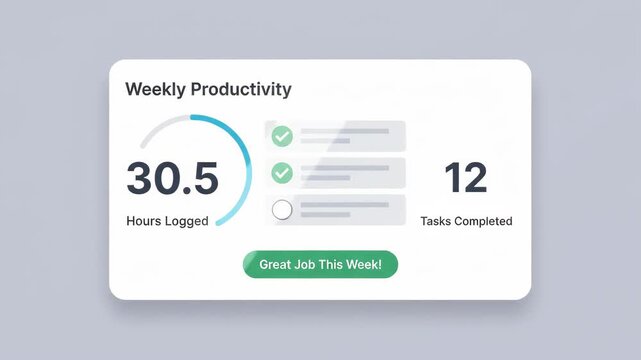
digital weekly productivity dashboard showing logged hours on sleek card UI interface floating against soft-focus minimal gray background visualizing progress through circular progress ring
00:06
Alta definición
Animated icons representing data processing and analysis on a black background
00:07
Alta definición
Graphical representation of ascending data bars showing a simple digital progress indicator for website user interface and mobile application design
00:10
Alta definición
A blue circular progress bar displays 33 percent completion on a white background
00:15
Alta definición
A person uses a laptop to explore ideas related to artificial intelligence and chatbots. The colorful chart shows various aspects of AI. The background is a simple workspace.
00:10
Alta definición
Neon pink glowing global analytics icon with pie chart and user profile on black background
00:08
Alta definición
A dark mode histogram titled "User control Analysis" displays a distribution of data with various grey bars on a stark black background.
00:05
Alta definición
A graphic representation of a blue rectangular prism with a bar chart on top against a dark background
00:24
Alta definición
Simple financial dashboard on a computer screen 4k
00:06
Alta definición
Business workflow vector illustration with user icon progress ring line graph and bar chart for data analysis and growth tracking
00:06
Alta definición
Minimalist project management dashboard interface showing task lists
00:15
Alta definición
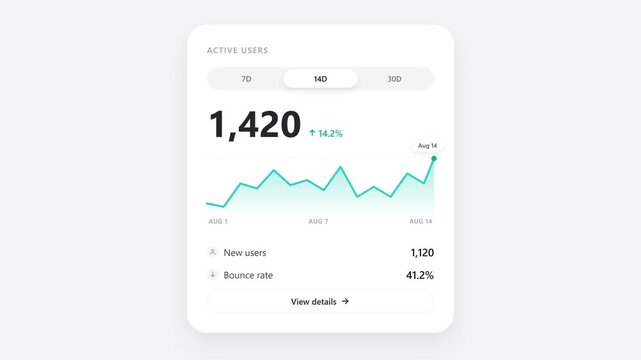
Digital analytics dashboard displaying website traffic growth with upward trend line and key performance indicators
00:08
Alta definición
 Financial Choice Concept, Business Decision and Modern Graphic 4k animation. Neon $840 vs $730 Price Comparison Animated with Glowing User Silhouettes, Dual Cost Display, Digital Pricing Analysis.
00:10
Alta definición
Futuristic dark interface displays a purple circular progress indicator alongside four mini bar graph widgets against a black background
00:30
Alta definición
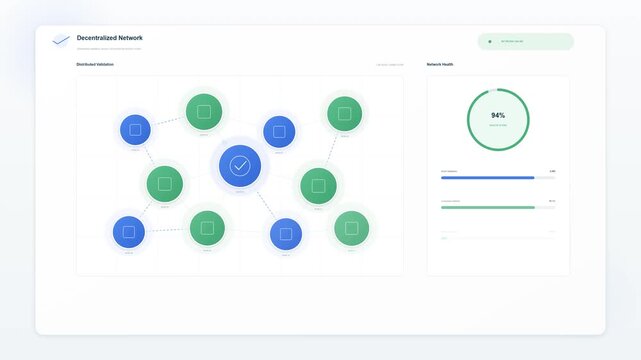
Animated data visualization dashboard with network graph interface
00:10
Alta definición
Secure User Login and Authentication Process Animation on Laptop with Account Profile and Data Charts
00:10
Alta definición
Sales Funnel Dashboard, Clean Motion Graphic Animation Showing User Conversion, Revenue Stats And Data Visuals, Minimalist White Interface Background, Professional Asset For Business Marketing Softwa
00:08
Alta definición
Modern graphic illustrating a user profile card with data metrics and a person icon on a grid background.
00:26
Alta definición
White line of a person standing above a medium readiness level progress bar on a black background
00:10
Alta definición
Computer Monitor Displaying Business Dashboard Interface on Green Screen Background.
00:10
Alta definición
teal circular progress bar showing data loading at forty-seven percent inside digital window popup against plain dark grid background
00:06
Alta definición
Abstract graphic representation of people and data in a list format
00:07
Alta definición
Horizontal progress bar with colorful segmented sections for loading process, data measurement, step completion, workflow status, and graphic timeline elements on transparent background
00:05
Alta definición
Circle Loading animation from 0 to 100 with transparent background. Abstract circle frame loading icon animation, Modern User Interface Design Concept,
00:10
Alta definición
Line Art Animated Bar Chart Showing Growth Metrics on White Background
00:10
Alta definición
Modern dashboard interface animation glows with green borders. Control room telemetry data updates on the dashboard interface. High tech user displays guide the dashboard interface.
00:08
Alta definición
A dark mode histogram titled "User control Analysis" displays a distribution of data with various grey bars on a stark black background.
00:10
Alta definición
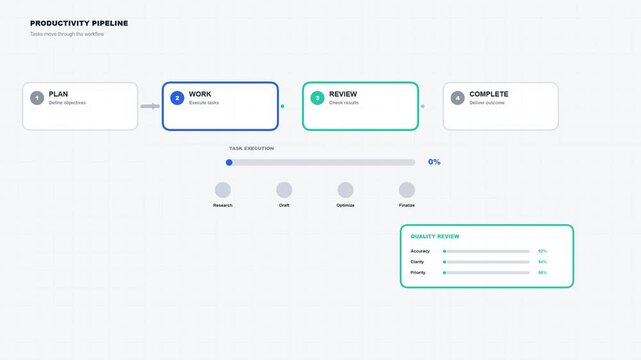
Animated Business Process Timeline with Four Stages Progress Bar.
00:05
Alta definición
Collection of conceptual user interface elements including a color picker. Monitor with a successful interaction. And a web browser showing data visualization
00:17
Alta definición
Neon-lit graphic design on a laptop and smartphone against a dark background with colorful bars.
00:08
Alta definición
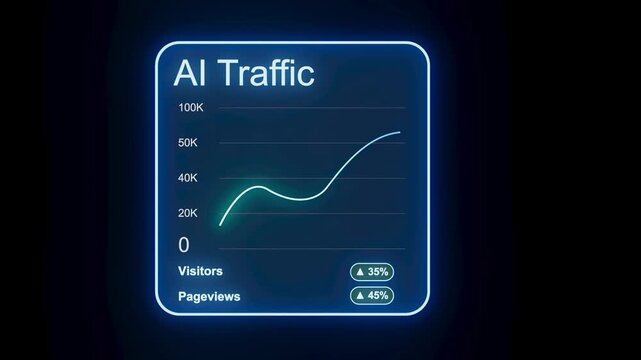
Graph displays AI traffic data with numbers for visitors and pageviews. The design has a blue background with a simple line showing trends.
00:10
Alta definición
Futuristic digital interface with hand selecting executive profile in corporate organizational chart
00:05
Alta definición
 Financial Choice Concept, Business Decision and Modern Graphic 4k animation. Neon $860 vs $750 Price Comparison Animated with Glowing User Silhouettes, Dual Cost Display, Digital Pricing Analysis.
00:10
Alta definición
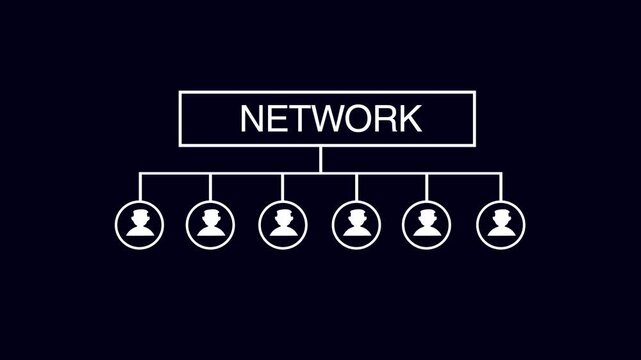
Simple diagram showing a network structure with connected user icons on a dark background, ideal for business, teamwork, communication, technology, and organization concepts.
00:12
Alta definición
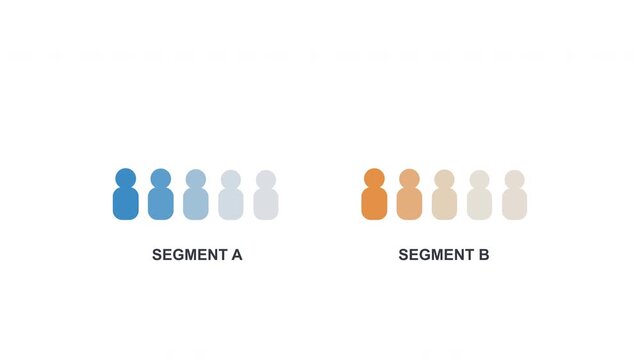
Two groups of people icons representing different segments, data visualization
00:06
Alta definición
A red circle growing and displaying 45% then 50% on a white background, motion graphics for business presentations.
00:05
Alta definición
A green graphic loop animation shows a rising bar chart on screen
00:05
Alta definición
User profile icon connected to a data information card on a white background.
00:10
Alta definición
White line of a person standing above a medium level progress bar on a black background
00:10
Alta definición
Business Funnel Conversion Chart on Green Screen Background
00:15
Alta definición
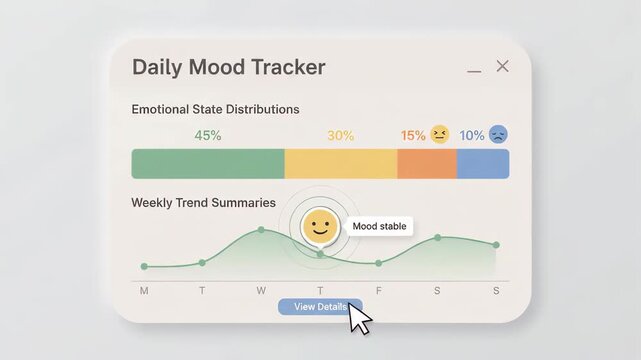
digital daily mood tracker interface showing emotional state distribution percentages and weekly trends in floating window against minimalist light gray soft-focus background
00:06
Alta definición
Animated icons show contrasting emotions and feedback levels on black background
00:06
Alta definición
Horizontal progress bar with colorful segmented sections for loading process, data measurement, step completion, workflow status, and graphic timeline elements on transparent background
00:05
Alta definición
Dashboard Interface Displaying Minimalist Waveform Notification on Digital Screen with Modern UI Design, White Background, and User Interaction Element
00:10
Alta definición
Productivity dashboard interface with progress tracking flows
00:15
Alta definición
HUD UI/UX for games, motion design,. Futuristic user interface HUD and Infographic elements. Abstract virtual graphic touch user interface. UI hud infographic interface screen monitor. High Tech, 4K
00:15
Alta definición
A dark mode histogram titled "User control Analysis" displays a distribution of data with various grey bars on a stark black background.
00:19
Alta definición
Set animation graphic futuristic HUD elements for user interface. Technological screen looped elements for broadcast, games, advertising, business.
00:20
Alta definición
Futuristic user interface HUD GUI digital text number element for cyber technology concept with shallow depth of field dark and grain processed
00:30
Alta definición
HUD graphic of screen. Futuristic user interface glow GUI digital text and number random element for cyber technology concept. Focus graph and  charts depth of field dark and grain processed.
00:11
Alta definición
Digital abstraction with seamless animation flickering digits of business, finance, technology or marketing on display screen. Animation. Big data on LED panel
00:15
Alta definición
Team Data Analysis Motion Icon. Animated icon of a team with a pie chart, representing collaborative data analysis, business performance reporting, and professional group statistics.
00:10
Alta definición
 Financial Choice Concept, Business Decision and Modern Graphic 4k animation. Neon $210 vs $310 Price Comparison Animated with Glowing User Silhouettes, Dual Cost Display, Digital Pricing Analysis.
00:10
Alta definición
A line icon showing a browser window with a bar chart and human figure symbolizing user analytics or profile statistics in a web application
00:10
Alta definición
Animated arrow points upwards on a dark, minimalist background
00:06
Alta definición