Se ha enviado un vínculo para establecer tu contraseña a: Para acceder a tus compras en el futuro, necesitarás una contraseña.
Consigue 3 vídeos o 25 imágenes con una versión de prueba gratuita
Se han añadido nuevos filtros
Ordenar por

95.005 resultados para chart , digital , plot en vídeos

Business people discussing financial stock market graph analysis and trading strategy on computer screens in office
00:23
Alta definición
A hand presenting a virtual bar chart illustrates increasing growth with digital lines and a futuristic backdrop, symbolizing financial success and analytics. Copula
00:10
Alta definición
A person is using a laptop and looking at graphs and symbols related to investing. There are stacks of coins on the table. The setting looks like an office.
00:10
Alta definición
AI payroll system interface showing employee salary data, budgeting graphs, and monthly calendar used on laptop for digital finance management and automated compensation planning in business setup, 4k
00:12
Alta definición
Blue arrow graph rising through digital bar chart during economic growth with dark background
00:05
Alta definición
Adult female business presenter speaks beside digital performance dashboard, using expressive gestures while explaining growth analytics to seated audience during corporate intelligence presentation.
00:13
Alta definición
Businesswomen analyzing global market trends and revenue data during a corporate presentation, teamwork, data analytics, financial strategy, and technology-driven decision making in a modern office.
00:17
Alta definición
Scheme hierarchy management of corporate. Digital technology of business process and workflow automation with flowchart and processing management.
00:13
Alta definición
Business implementation strategy concept with digital icons, global network and financial growth charts
00:10
Alta definición
Human Resources Dashboard with Employee Analytics and Workforce Management Animation.
00:15
Alta definición
Tablet chart graph data analysis hand stylus report business digital dashboard colorful analytics screen finance planning office workspace reviewing document growth insights
00:10
Alta definición
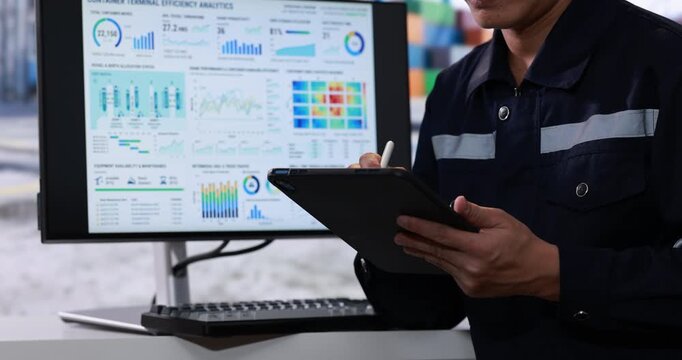
Industrial worker uses a tablet beside a computer monitor displaying colorful production data charts and performance dashboards in a factory office.
00:21
Alta definición
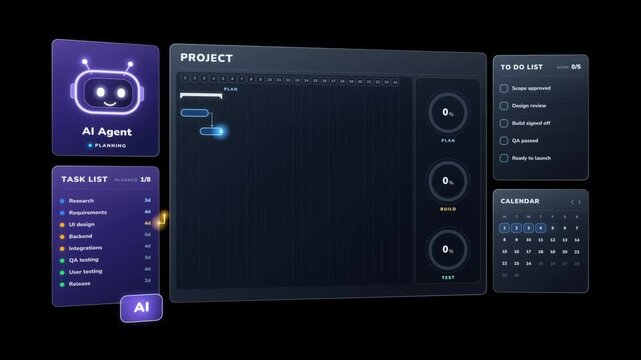
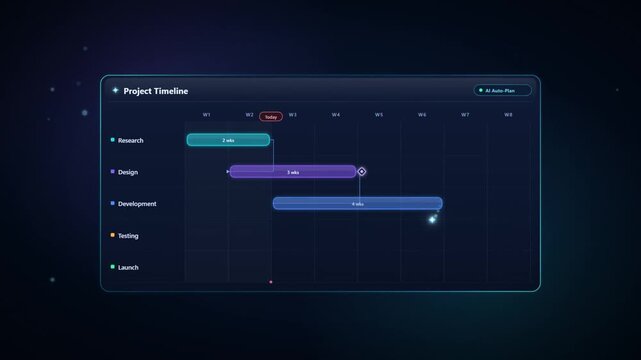
Gantt chart planned by an AI agent robot, then tracked through plan, build and test phases on a calendar
00:15
Alta definición
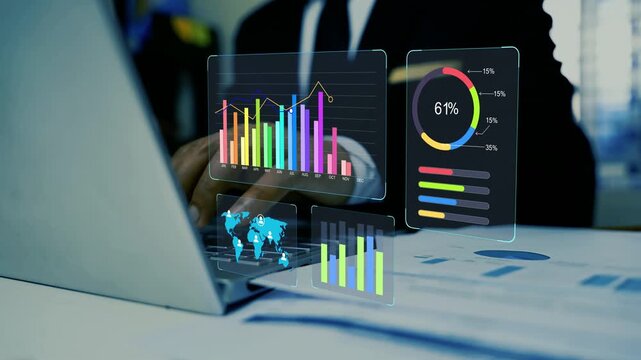
Business analytics dashboard with laptop in office, Business person using a laptop with holographic floating digital charts and data dashboards on a desk
00:10
Alta definición
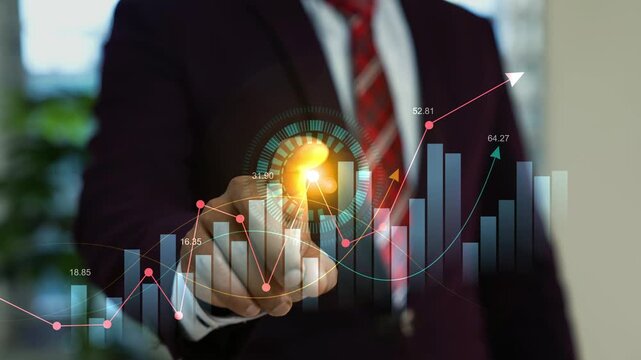
Businessman touches a glowing digital hologram chart with rising bars, arrows and data lines, showing financial growth, investment planning and market analysis.
00:09
Alta definición
Digital Document Download Illustration Featuring Analytical Business Charts and Reports
00:10
Alta definición
Abstract digital arrow pointing upwards, representing growth and progress in the future
00:08
Alta definición
Abstract digital project management board with interactive task cards and notifications on a dark purple background
00:10
Alta definición
Growing financial bar chart with upward trending arrow, showing business growth and positive investment, digital abstract background
00:08
Alta definición
Hand placing a bar on a chart while displaying various types of graphical representations, concepts of data analysis, financial growth, and business strategy
00:17
Alta definición
Chart, meeting and business women on computer screen for stock market, trading and investment. Corporate, night and people pointing on pc for financial review, graphs and research for cryptocurrency
00:05
Alta definición
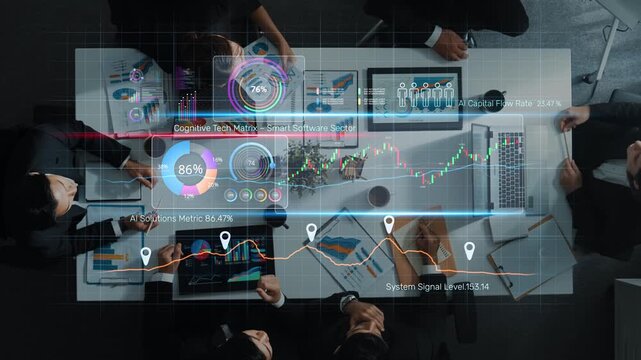
Explore a modern workspace showcasing advanced data analytics and cognitive technology with digital dashboards. Perfect for illustrating business strategy and innovation. Raster
00:20
Alta definición
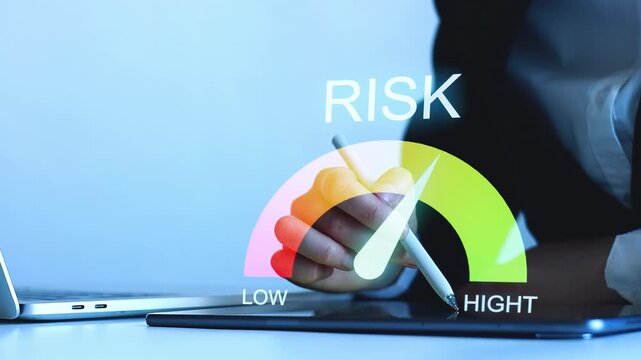
Understanding risk levels in finance using a digital display during a business meeting in an office.
00:10
Alta definición
Business strategy, target and planning concept. Person typing on keyboard with target bullseye, growth roadmap and strategic gear icons, corporate goal setting and vision execution.
00:10
Alta definición
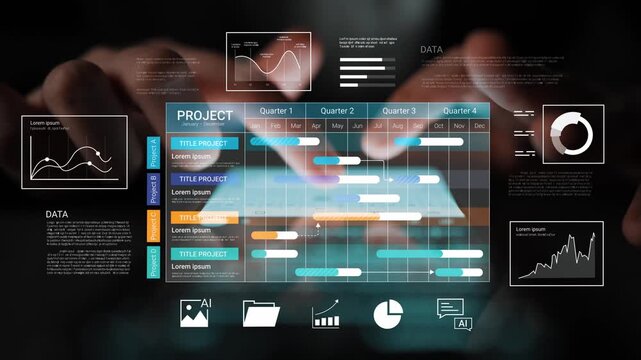
Abstract Gantt chart project management dashboard showing task schedules, progress bars and monthly timelines on digital background, illustrating workflow planning and project tracking.
00:12
Alta definición
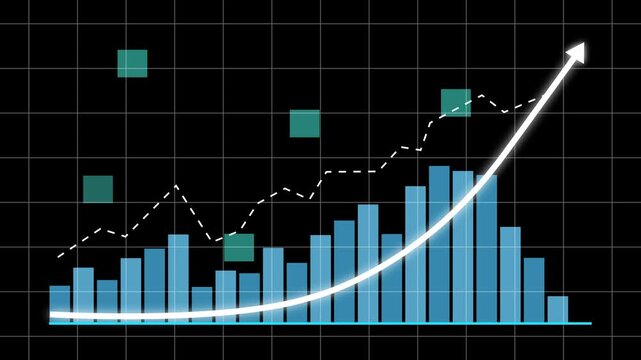
Dynamic financial growth bar chart animation with rising trend line and glowing success arrow for corporate business presentations, stock market analysis, economic forecasting, and data visualization
00:10
Alta definición
Business timeline 12 months, glowing milestone markers lighting up in sequence, annual progress roadmap, seamless loop 4K
00:12
Alta definición
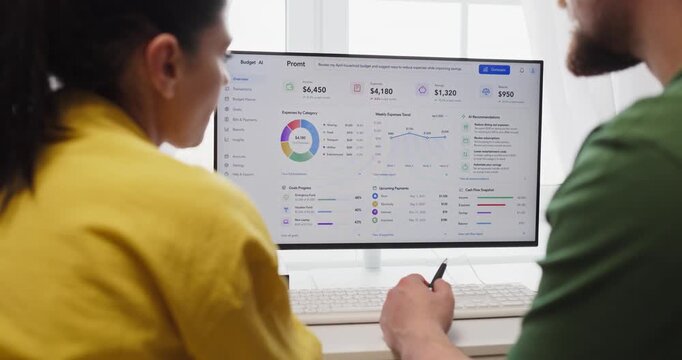
Couple budget planning on finance dashboard online. They review savings and monthly expenses on a computer at home using charts analytics for smarter choices. Clear concept of home finance teamwork
00:08
Alta definición
A young professional is examining investment data graphs and charts, analyzing financial information, and monitoring stock market trading reports.
00:38
Alta definición
Glowing digital business growth chart showing positive trend and upward progress video
00:06
Alta definición
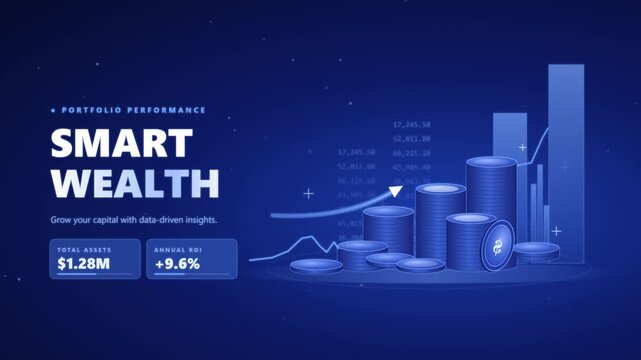
Financial growth concept with blue digital interface showing animated rising bar charts and coin stacks for wealth management and investment planning
00:08
Alta definición
Industrial worker using a tablet beside a monitor energy efficiency charts and factory data in a modern control room.
00:26
Alta definición
Businessman touching a futuristic digital control panel with big data graphs, charts and key performance indicators, concept of data analysis, business intelligence and IoT management
00:07
Alta definición
Data visualization animation showing digital bar charts and abstract network nodes moving across white background in dynamic business video footage
00:10
Alta definición
Business growth and financial analytics, with a professional touching digital charts and graphs for strategy, planning and success at office desk.

00:07
Alta definición
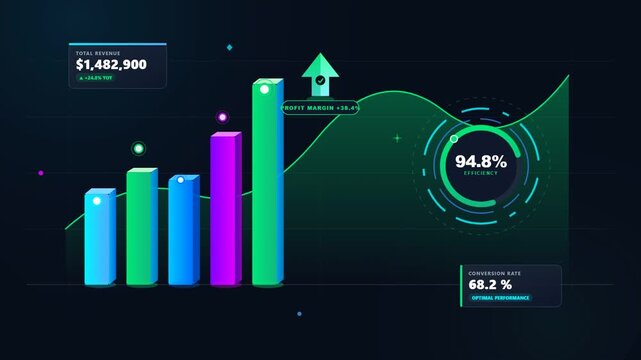
Animated financial dashboard with glowing bar charts and upward revenue growth metrics
00:15
Alta definición
BPM business process management automation technology concept HUD interface with digital system icons
00:15
Alta definición
Social media analyst monitoring performance metrics on dashboard interface. Audience engagement tracking, digital marketing campaign analysis, data visualization, and content strategy optimization.
00:10
Alta definición
Businessperson using a laptop with a digital hologram finance dashboard, Holographic financial planning dashboard with growth chart animation
00:09
Alta definición
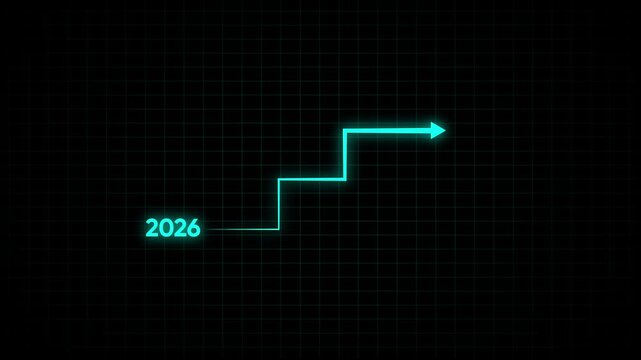
Neon digital growth chart transitioning from 2026 to 2027: business strategy and financial planning concept
00:10
Alta definición
Businessman hands typing on a laptop with a glowing hologram bar chart animation on the screen, Holographic online business growth data analysis and financial progress in a dark office
00:06
Alta definición
Explore a dynamic interface showcasing business analytics, data visualization tools, and interactive charts for effective decision making and strategic planning. Cipher
00:10
Alta definición
Side Profile Portrait of Stockbroker at Desk Looking at Computer Screens Showing Stock Exchange Data, Equity Charts, Investment Analytics, Asset Management, Financial Graphs to Track Market Trends
00:16
Alta definición
Digital tablet showing business graphs and financial data charts in an office
00:05
Alta definición
Business person using a laptop with hologram glowing charts and rising arrows animation on the screen, Business data growth, finance planning, market analysis and digital business success
00:08
Alta definición
Agentic ai multi agent collaboration workflow diagram with data input process analysis and auto optimize concept for future technology modern office
00:08
Alta definición
Business professionals analyzing stock market financial growth charts on digital screens.
00:07
Alta definición
Mature woman analyzes budget charts and bills. She uses a computer dashboard to review expenses and finance data for monthly household planning. Everyday digital money management concept.
00:13
Alta definición
Business growth roi increase with ai integration system development reduce cost improve efficiency successful corporate strategy innovation project management strategic planning corporate progress
00:05
Alta definición
Businessman touching on hologram digital dashboard overlay showing graph charts, map and growth data animation, Holographic modern business analytics, finance planning and market performance
00:10
Alta definición
Hands working on a smartphone while graphs and icons are displayed on a screen representing data and analytics in business settings
00:10
Alta definición
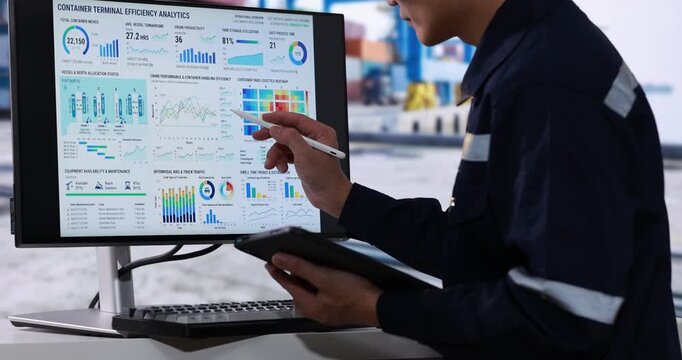
Industrial worker in hard hat and safety glasses reviews data dashboard on a computer monitor at a shipping container terminal.
00:19
Alta definición
Financial growth bar chart with rising trend line, digital business analytics and market performance visualization
00:15
Alta definición
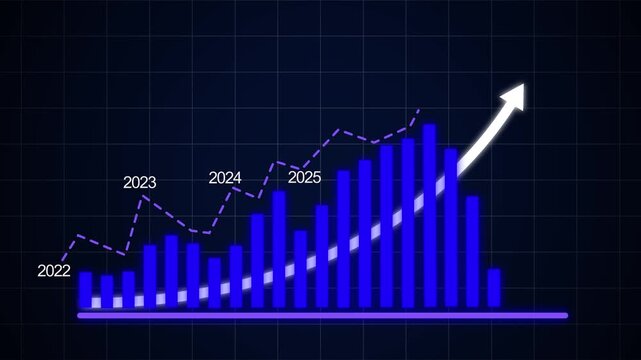
Dynamic financial bar chart animation representing annual business growth and market success from 2022 to 2027 with rising trend arrows and data visualization for corporate economic presentations
00:10
Alta definición
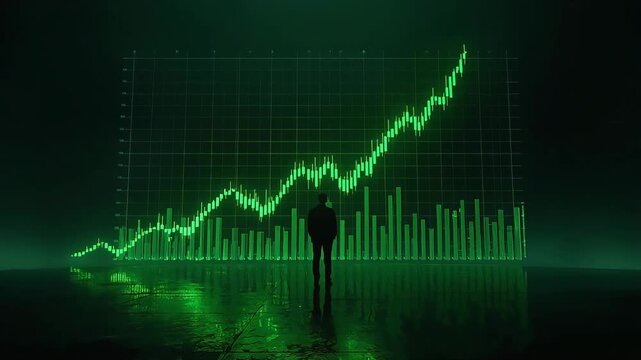
Businessman analyzing glowing green financial stock market chart with upward growth trends in this high quality digital motion video clip
00:05
Alta definición
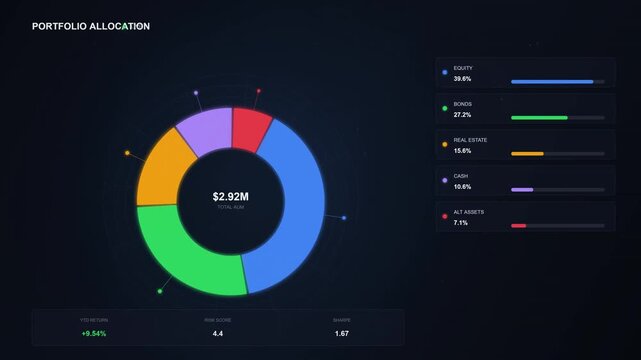
Cutting-edge digital interface showcasing dynamic financial portfolio allocation with an interactive donut chart and detailed investment insights, rendered in a sleek, modern visual display
00:10
Alta definición
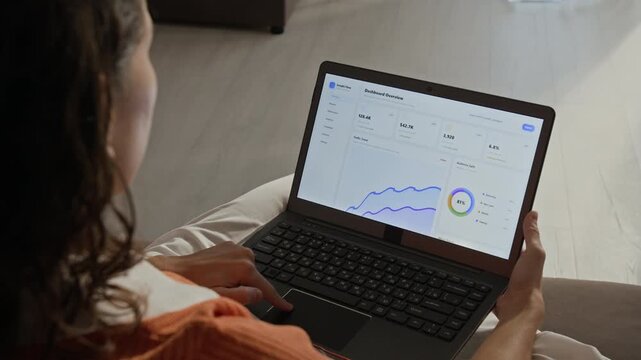
Over shoulder shot of Caucasian young adult woman analyzing business metrics and scrolling through dashboard analytics on laptop. Clip perfect for marketing campaigns about remote work and e-commerce
00:08
Alta definición
Senior insurance advisor showing financial charts and data on a tablet to a young female client during a professional office consultation.
00:12
Alta definición
Business person touching a digital holographic financial chart with glowing bars and data icons animation, Hologram market analysis growth strategy and modern technology
00:10
Alta definición
Hands, tablet and person writing in notebook for planning, agenda or financial report. Accountant, notes and digital bookkeeping with to do, data analytics or tasks for business audit and summary
00:06
Alta definición
Businesswoman analyzing financial reports and accounting data, using a calculator and digital tablet for strategic planning and economic success in the modern office
00:11
Alta definición
An illustration representing a digital organizational chart set in a modern office, showcasing team structure and collaboration among business professionals for strategic planning. Raster
00:20
Alta definición
Two business professionals analyze financial documents and digital data charts on an interactive table screen using a pen and calculator during a corporate strategic planning meeting.
00:08
Alta definición
Business team reviewing a house model, financial charts and digital data on a desk during a real estate investment meeting.
00:11
Alta definición
Businessman using a laptop with hologram digital charts and growth icons  , Business growth chart and data analysis on laptop
00:08
Alta definición
Teamwork, tablet and collaboration among three office colleagues comparing a digital report with printed charts at a desk, for business analysis, project planning and professional discussion.
00:18
Alta definición
Futuristic project management dashboard display with glowing digital data charts and interactive financial analytics interface on a dark high tech background loop
00:15
Alta definición
Workflow process optimization interface displaying business methodology layout and corporate data analytics.
00:14
Alta definición
Digital data graph with glowing blockchain network and modern finance technology background
00:10
Alta definición
Digital project management interface featuring animated Gantt charts and task scheduling timelines.
00:11
Alta definición
Five milestone roadmap infographic concept for project planning and showing business growth stages in a company timeline presentation animation
00:10
Alta definición
Business colleagues review financial charts and digital reports on a touchscreen table during a meeting, showing teamwork, planning and data analysis.
00:21
Alta definición
A person types on a laptop in a dimly lit setting. Green digital images of charts and graphs appear in a layout on the screen, suggesting data analysis or financial planning.
00:10
Alta definición
Hand typing on laptop keyboard with digital hologram financial chart gear for enterprise technology data analytics performance optimization business revenue growth investment strategy success profit
00:10
Alta definición
Businessman reviewing holographic financial charts on a laptop and documents with a glowing digital graph overlay, Business analyzing financial charts at office desk
00:11
Alta definición
Holographic glowing data charts and digital icons business person holding above the hand in a modern office, Business finance growth analytics planning and technology innovation
00:09
Alta definición
Hormuz Two-Way Lanes Navigation Visualization, Maritime Traffic Flow, Geospatial Mapping Animation, Oceanic Route Planning, Digital Topography, Seamless Loop, Modern Navigation Graphics
00:12
Alta definición
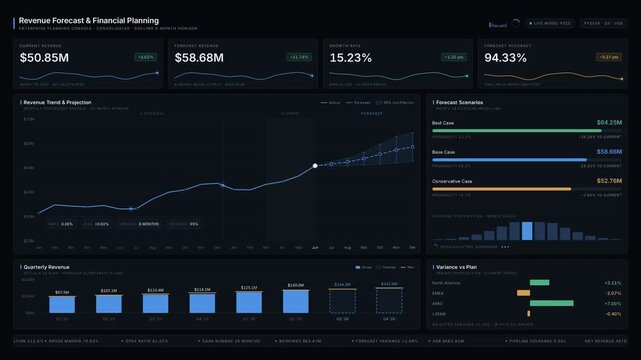
Professional revenue forecasting and financial planning dashboard animation featuring KPI cards, trend charts, and scenario forecasts for corporate presentations in dark mode.
00:15
Alta definición
Dynamic financial growth bar chart animation featuring rising green columns and upward trending arrow representing annual business success and economic development projections from 2022 to 2027 period
00:10
Alta definición
Meeting, graphs and documents with business hands in office for company profit, revenue and pitch. Paperwork, charts and financial manager with people for investment planning, budget or teamwork
00:11
Alta definición
Corporate governance concept with enterprise compliance, intelligent business management, digital oversight and secure operational frameworks.
00:14
Alta definición
Interactive Data Visualization Dashboard with Project Management Metrics and Analytics for Business Review and Planning in Modern Office Environment Gluon.
00:10
Alta definición
Animated AI project timeline dashboard automatically generating Gantt chart schedule for roadmap
00:12
Alta definición
Businesspeople collaborate on a project, analyzing documents and data in a modern office. Coworkers review plans and digital charts together, fostering a productive work environment.
00:08
Alta definición
Digital charts global map rising market curves. financial technology, market volatility, economic research, portfolio analysis, trading dashboards, global growth, corporate strategy business news.
00:20
Alta definición
Business analytics, laptop and charts on an office desk with colorful pie graphs, line plots and performance indicators on screen; digital reporting for research, evaluation and data visualization.
00:11
Alta definición
Doctors show teamwork at computer for records consultation. Two physicians review charts on dual monitors, coordinating diagnosis and updating files. Concept of digital healthcare teamwork.

00:07
Alta definición
Animated bar chart with rising trend arrow showing business growth and financial success
00:05
Alta definición
Animated white bar chart graph with rising trend arrow on a clean black background, representing financial growth, business success, data, analysis, market expansion, and positive economic progress
00:10
Alta definición
Businessman working with laptop and virtual Gantt chart for project management, planning schedule, and task tracking workflow. Professional concept for corporate efficiency and digital organization.
00:12
Alta definición
Financial analyst monitoring live market charts across multiple screens in a dim office environment with focused data driven decision making
00:10
Alta definición
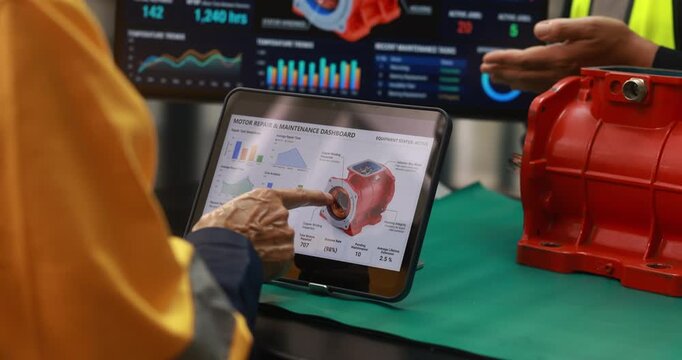
Industrial maintenance team using a tablet to inspect machinery data beside a red mechanical component, with digital charts and factory equipment in the background.
00:19
Alta definición
Reviewing business report on digital tablet
00:11
Alta definición
Businessman achieving success through strategic planning and professional development motion animated 4k video.
00:10
Alta definición
Man working on payroll with laptop, pen, calculator and charts on desk with digital payroll icons
00:10
Alta definición
Arabian presenter standing near digital display with charts and data, addresses small group of colleagues, negotiating, discussing financial or business analytics, gathered in modern conference room
00:14
Alta definición
Crypto, stock market and graphic hologram of data in the trading industry with digital technology. Number statistics on virtual interface business chart of live economy currency with analytics system
00:06
Alta definición
Multiethnic Youthful Group of People Preparing a Presentation in a Casual Conference Room at Office. Startup Data Team Discussing Process Using Laptop and Charts. Zoom Out Wide Shot
00:12
Alta definición
A confident Indian businesswoman delivers a dynamic presentation in a modern corporate boardroom, showcasing financial growth and data analysis on a large interactive digital screen to her attentive .
00:08
Alta definición
Woman presenting financial data on large screen to diverse team in modern office boardroom, showing analytics and business strategy development
00:08
Alta definición