A link to set your password has been sent to: To access your purchases in the future you will need a password.
Create without limits — unlimited downloads, plus powerful AI editing
New filters added
Sort by

10,099 results for sequence chart in videos

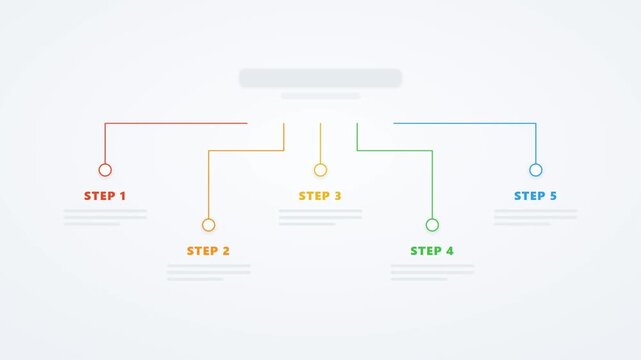
Five step process infographic with animated connecting lines and options presentation template
00:05
HD
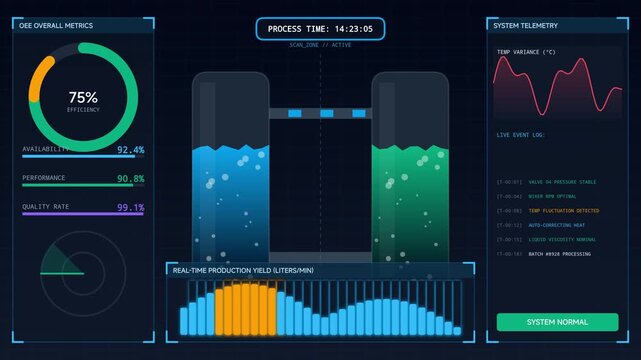
High-tech industrial dashboard interface displaying automated production metrics, chemical tank levels, and system analytics for smart factory monitoring
00:10
HD
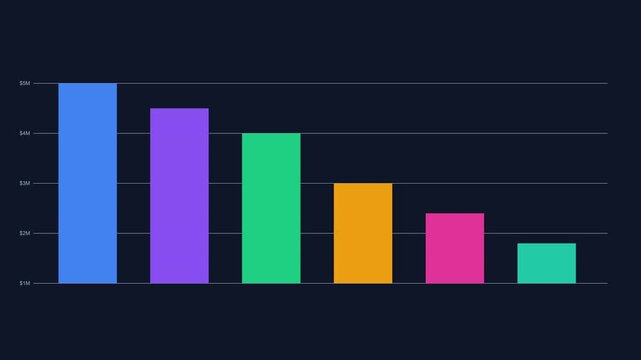
Colorful vertical bar chart loop against a dark reflective background.
00:30
HD
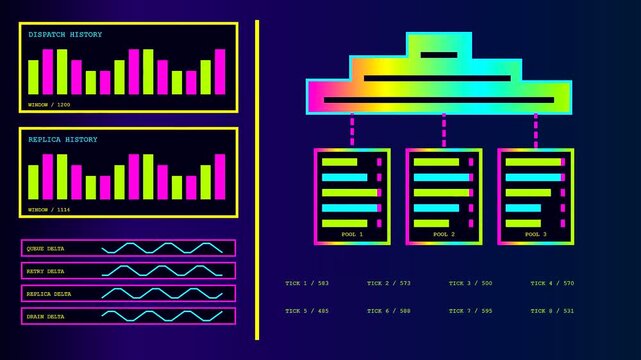
Digital displays showing cloud orchestration in a dynamic interface with moving bar graphs and glowing neon linear charts presented as a three part video sequence
00:06
HD
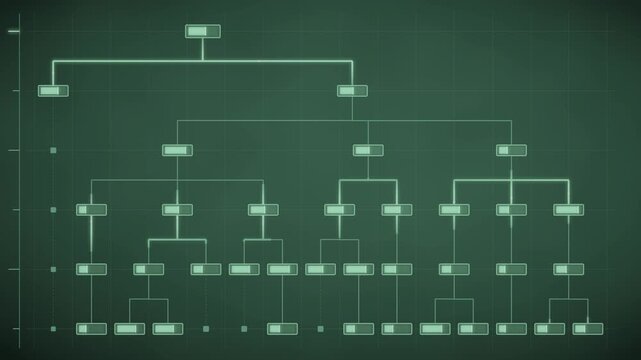
Org Chart Hierarchy Tree Diagram Growing From Root With Nodes Lighting In Sequence, Seamless Loop in bright emerald tones
00:10
HD
Guidance infographic 3 steps template animation. Information screen. Sequence options 4k video. Animated blank diagram visualization. Process layout empty design element. Motion graphics
00:12
HD
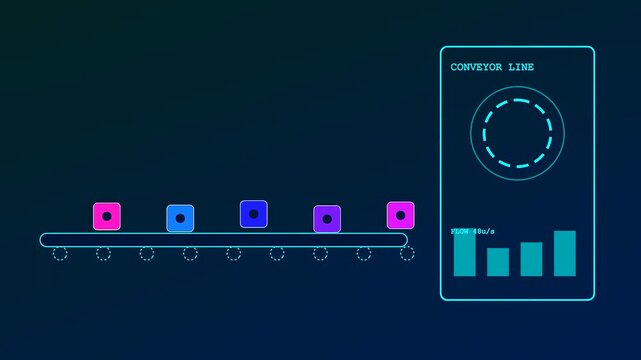
A modular assembly line flows with colorful cubes passing digital monitoring screens showing fluctuating bar charts in this smooth animated sequence of automated industrial logistics systems
00:06
HD
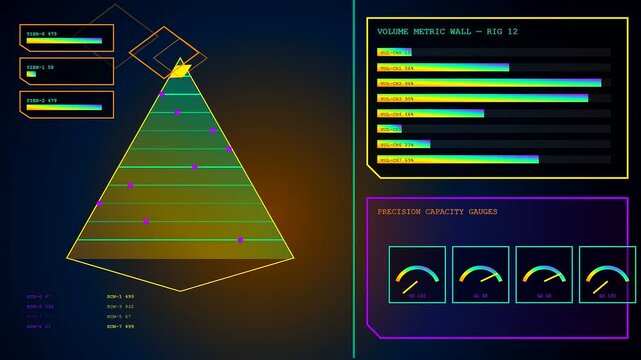
A sequence showing volumetric diagnostics displayed as glowing yellow geometric pyramid shapes with shifting bar charts and digital interface meters on a dark gradient display screen
00:06
HD
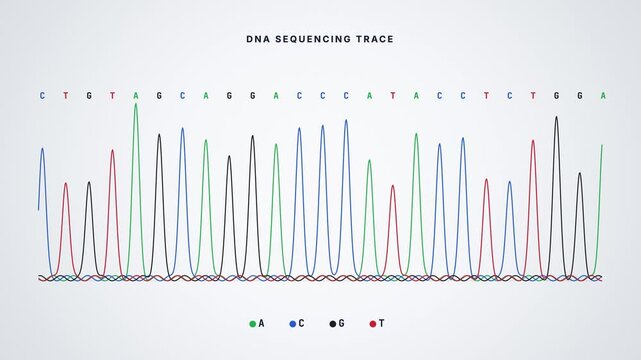
Scrolling DNA sequencing chromatogram with colour-coded base call peaks, seamless loop
00:15
HD
Stock market candlestick chart animation displays financial analytics. Market candlestick chart layout tracks corporate investment metrics. Chart sequence is sleek.
00:12
HD
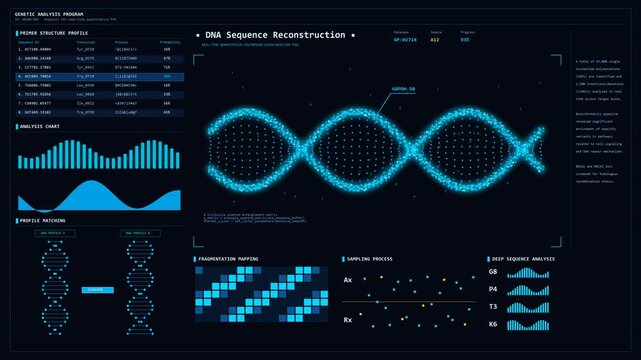
Bioinformatics HUD screen with 3D DNA sequence and PCR charts
00:24
HD
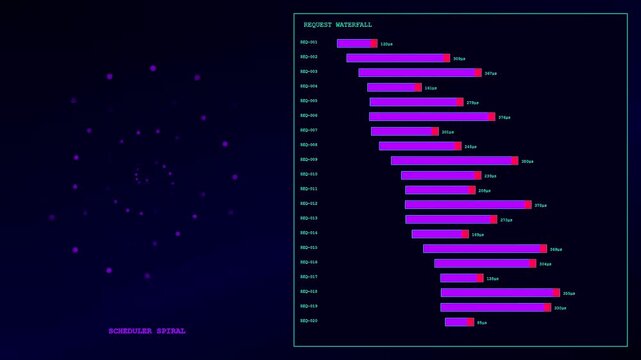
Monitoring system analytics with compute latency metrics presented in a dynamic glowing spiral interface with scrolling horizontal bar charts during a digital data processing sequence
00:06
HD
A sequence of frames showcasing a growing bar chart and upward-pointing arrow.
00:05
HD
4K Animated Financial Bar Chart Growth with Colorful Columns on Dark Background
00:05
HD
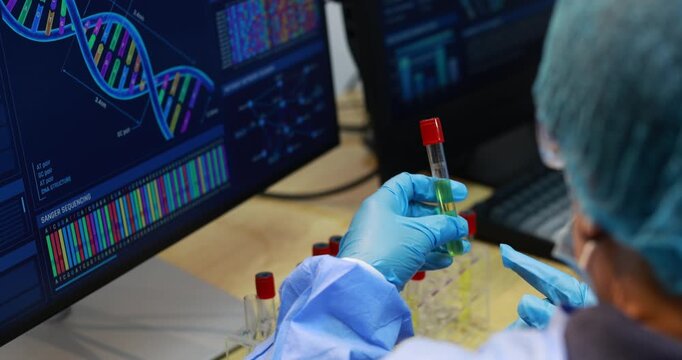
Scientists in a laboratory examine a sample vial while viewing dna sequence data and genetic charts on computer screens.
00:16
HD
Biotechnology DNA sequencing animation of rotating colorful double helix with glowing molecular bonds and scientific HUD data chart on dark background for genetics and bioinformatics research
00:15
HD
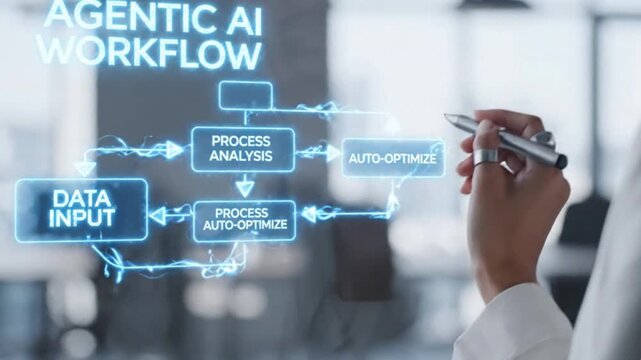
Agentic ai multi agent collaboration workflow diagram with data input process analysis and auto optimize concept for future technology modern office
00:08
HD
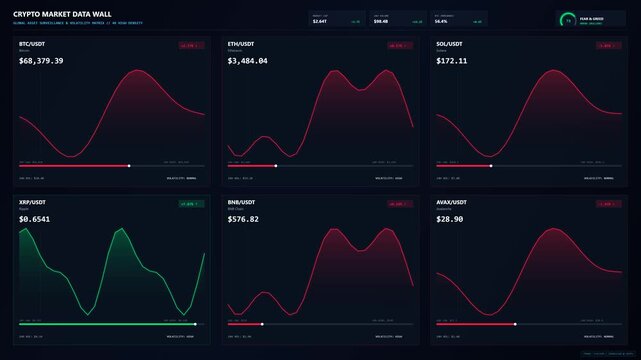
Multiple financial charts displaying real time market fluctuations
00:08
HD
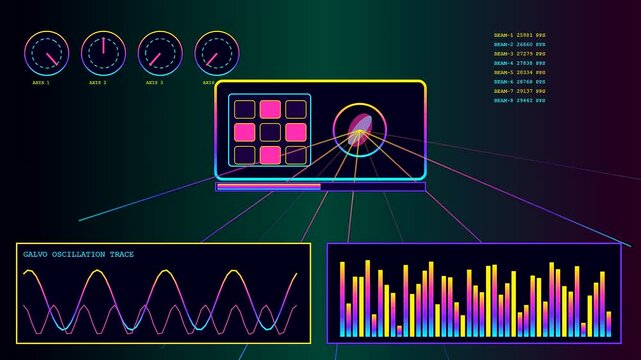
A digital dmx controller display interface showing shifting waveform patterns plus oscillating sound bar charts in a continuous looping motion sequence across a darkened computer monitor
00:06
HD
Dynamic motion of colorful bar chart visualization in digital data analysis video.
00:10
HD
Three step process infographic with glowing numbered circles connected on dark gradient background
00:10
HD
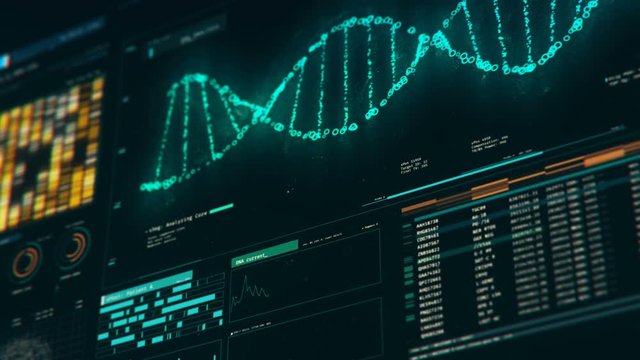
High-tech scientific screen visualizes DNA structures with animated charts, statistics and data analysis elements.
00:24
HD
A sequence showing probability modeling metrics changing in three distinct analytical phases with glowing neon curves and bar charts inside a dark digital display system interface
00:06
HD
Cloud orchestration interface displays data metrics with glowing neon charts and holographic circular monitors pulsing through sequence shifts in this dark digital system user portal view
00:06
HD
Process Flow Diagram with Arrows and Boxes Minimal Icon. Work flow Chart Symbol with Connected Steps. Flowchart Icon with Directional Arrows and Blocks .4K Motion Graphics.
00:10
HD
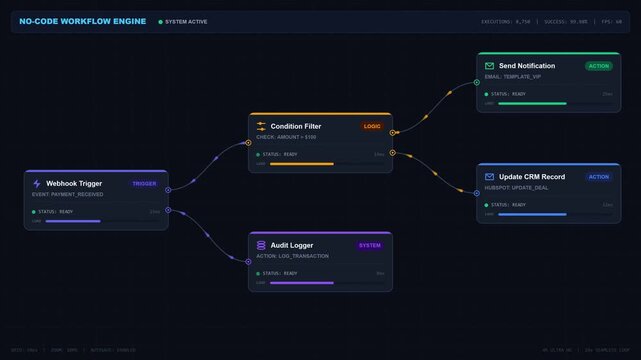
Automated workflow engine interface with digital logic flow and visual node programming builder
00:20
HD
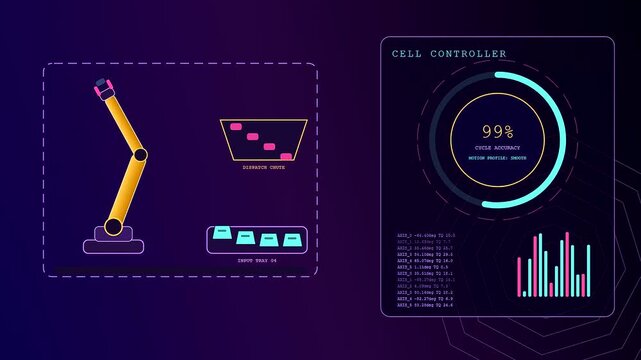
Digital displays showing pipeline automation sequences of robotic arms moving items between trays with glowing circular progress meters and data charts on a dark purple screen
00:06
HD
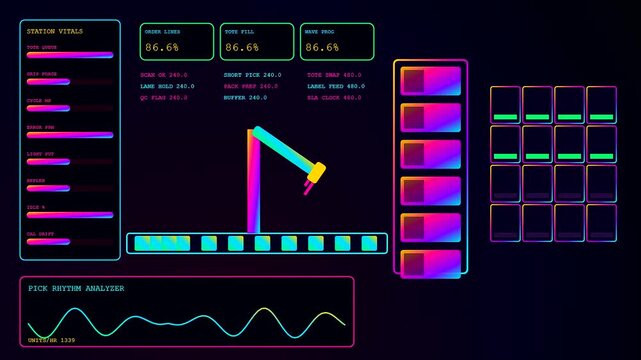
Industrial warehouse optimization monitoring software displays showing automated robotic pick and pack arm sequences with vibrant neon data charts on a dark digital interface screen system
00:06
HD
5 step infographic with colorful hexagons. 4K Video
00:10
HD
Animated five step timeline infographic with light blue circles and teal line on white background for business project presentation
00:10
HD
Soil sequencing displays appear on a dark interface showing rotating circular patterns with colorful glowing dots and vertical bar charts indicating progress during scientific analysis
00:06
HD
Digital staffing allocation interface displaying complex organizational hierarchy charts and data metrics on a dark glowing panel with shifting neon light patterns in motion sequences
00:06
HD
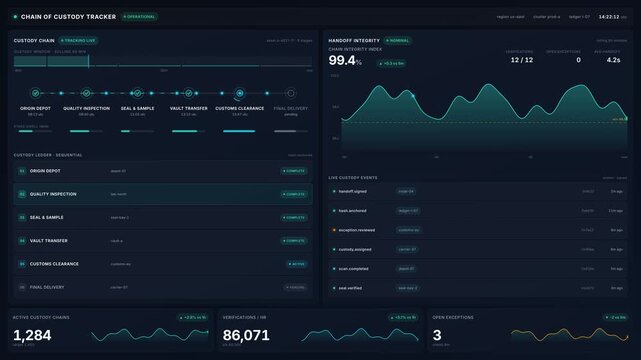
Chain custody tracker dashboard with supply chain monitoring, sequence verification, integrity index graphs, delivery logs for logistics asset tracking in 4k
00:20
HD
Futuristic DNA genetic research data visualization dashboard interface with medical charts and phylogenetic tree infographics. 4K Video
00:10
HD
Seated man leaning forward after spotting blue pie chart on laptop while comparing papers at table
00:13
HD
4k Resolution Video: Futuristic HUD DNA Analysis Interface. Cyan Genome Scan Dashboard With Double Helix, Chromosome Data, Sequencing Charts And Genetic Panels Animating On Black Background
00:25
HD
Animated Stock Candlestick Chart with Downward Trend
00:06
HD
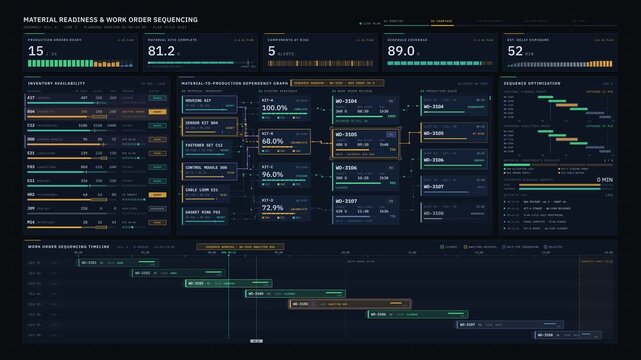
4K manufacturing control dashboard animation tracking material readiness and work order sequencing with dark enterprise UI and dependency flow for commercial creative technology and business use.
00:15
HD
a colorful bioinformatics interface featuring rotating circular neural network models and evolving bar charts presented as a three part sequence in a digital software display
00:06
HD
Dynamic motion of growing digital bar chart representing data increase in a futuristic style.
00:10
HD
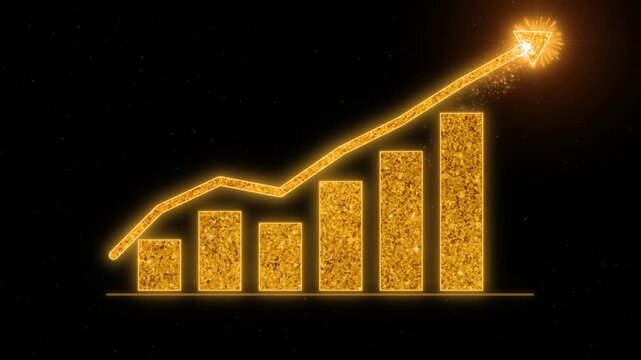
Rising bar chart and upward arrow revealed in a business graphic. Increasing columns illustrate growth, improved performance and financial progress through a clear ascending visual sequence.

00:12
HD
Dynamic glowing blue bar graph animation sequence with grid background for data visualization
00:07
HD
Animated Horizontal Timeline Infographic with Five Steps for Business Presentations
00:06
HD
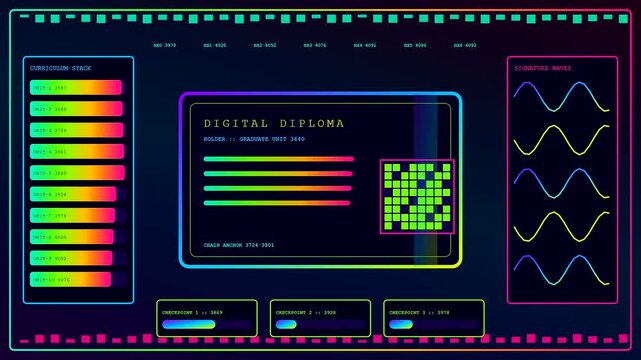
A digital diploma screen showing dynamic neon wave patterns and data bar charts in a glowing futuristic interface presented within a three panel video sequence
00:06
HD
Empathy driven social culture infographic circles animation. Community responsibility. Human centric brand principles. Flowchart dynamic presentation with 5 steps process. HD video, motion graphics
00:15
HD
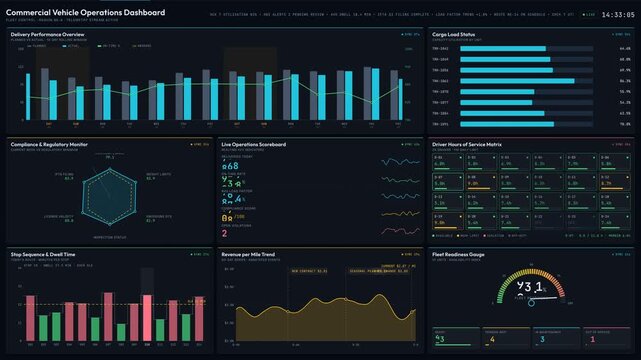
Explore a detailed commercial vehicle operations dashboard featuring a vibrant, information-rich interface with animated charts and KPIs for efficient fleet management and monitoring.
00:15
HD
Vitals monitoring interface displayed as a futuristic digital dashboard showing glowing data charts and temperature gauge metrics during a complex sequence of scientific computer analysis
00:06
HD
A sequence showing metric telemetry data displays evolving in a dark digital space with glowing circular loading indicators and fluctuating vertical bar charts on screen
00:06
HD
Animated 4 step infographic process timeline design. 4K Video
00:10
HD
Cinematic background of a countdown sequence of 3D numbers from 10 to 1, shattering into shards against a fractured backdrop, accented with blue light rays.
00:12
HD
Modern data visualization bar chart with fluctuating trends
00:10
HD
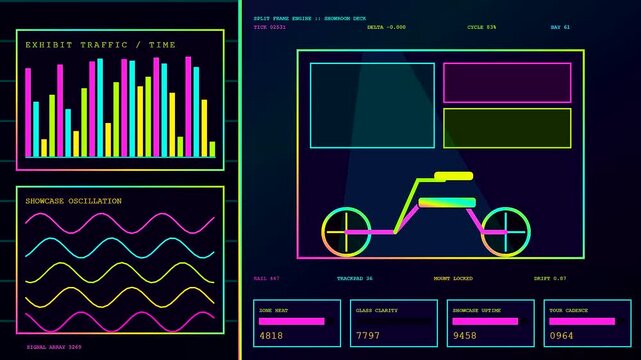
A digital virtual showroom display features neon cycle line graphs and glowing waveform monitor patterns across a dark gradient interface in this complex motion graphics sequence
00:06
HD
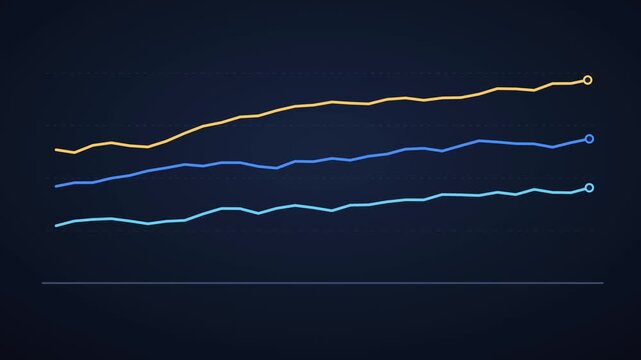
Three trend lines drawing in sequence for multi series comparison
00:12
HD
Minimalist pink animated data graph chart loop for business analytics and financial presentations
00:10
HD
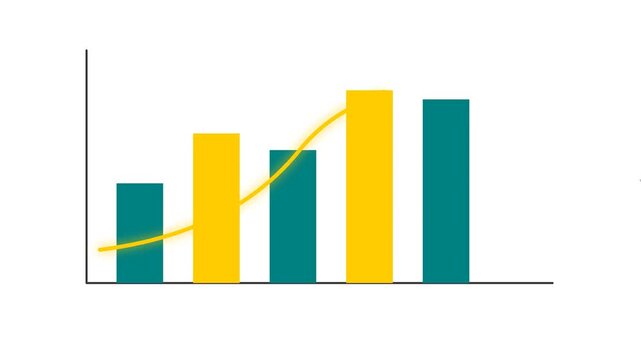
Growing bar chart animation sequence for financial business data
00:10
HD
A digital phishing alert display features multiple interactive monitoring dashboards with neon charts and stylized fish icons blinking in a sequence of simulated cyber attack activity
00:06
HD
Animated e-commerce dashboard showing shifting return rate percentages and customer lifetime value metrics in a professional digital interface for business analytics and marketing data performance
00:10
HD
Futuristic bio matrix user interface with genome sequencing charts
00:20
HD
A digital bioinformatics interface shows rhythmic glowing data lines and colorful bar charts fluctuating on a dark screen during a complex genomic laboratory research session
00:06
HD
Dynamic motion of colorful bar chart animation illustrating data visualization trends in motion.
00:10
HD
Isometric infographic template with four colorful database layers and numbered text boxes for business presentation workflow steps
00:08
HD
Animated sequence of bar chart frames showcasing data evolution and growth metrics.
00:15
HD
A digital sponsorship banner glows with vibrant neon metrics while changing data visualization charts populate the screen during this fluid and seamless motion graphics sequence
00:06
HD
A sequence showing dynamic pricing analytics presented through multiple blue bar charts displaying shifting data trends set against a dark screen for financial market insights
00:06
HD
Blue hexagon infographic 3 steps template animation, sequence options HD video, process layout empty design element, animated blank diagram visualization motion graphics on transparent background
00:08
HD
Neon bar graph growth and decline in progression against black background with subtle reflections
00:05
HD
a wage stream visualization displayed within three panel sequence shows glowing neon charts and metrics shifting across dark digital interface while processing financial data statistics
00:06
HD
Digital impression data flows across a sequence of monitoring screens displaying glowing neon bar charts and metrics that illuminate the dark screen for analytic observation
00:06
HD
A digital display featuring crisp genome editing software shows neon glowing gene sequences and colorful data charts to visualize complex molecular biology research through screen interfaces
00:06
HD
Minimalist diagonal line chart with glowing blue nodes on a dark background
00:10
HD
Animated bar chart with glowing gradient columns filling upward in ascending growth sequence
00:15
HD
Neon virtual showroom interface elements displayed on a digital grid monitor showing colorful waveform graphs and clock faces with analytical bar charts for monitoring system metrics
00:06
HD
Digital financial analytics display showing positive growth trajectory with fluctuating bar chart trends and data points in a modern software interface
00:08
HD
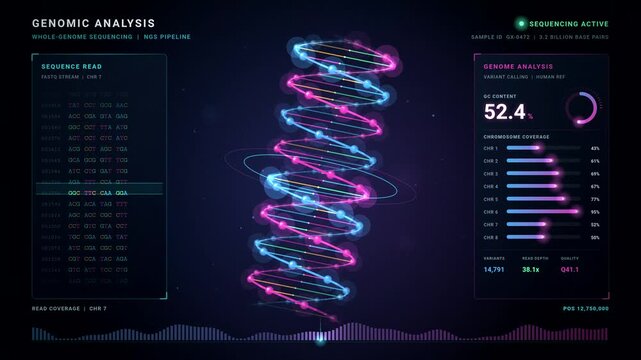
DNA helix rotating in digital genomic analysis interface with data charts
00:10
HD
Financial candlestick chart showing stock market price movement
00:08
HD
A digital screen displaying algorithmic trading charts with shifting colorful data squares and neon glowing wave patterns representing financial market oscillations in a modern software interface
00:06
HD
Curved dashboard popping in, bar charts rising, lines fluctuating and panels sliding for insights
00:12
HD
Futuristic DNA sequence analysis user interface with data charts
00:20
HD
a colorful bioinformatics interface featuring rhythmic data bars and circular charts displaying moving waves of information in a repeating sequence of digital graphic elements
00:06
HD
Sinusoid wave analysis data network technology on futuristic overlay
00:20
HD
top ten countdown, neon light numbers from 10 to 1, laser ray appears on black background and fly forward,
00:27
HD
Blue colored flow chart to visualize business concepts, industrial process, organization, procedures or strategy. Workflow, operation, planning, steps, sequence and development.
00:20
HD
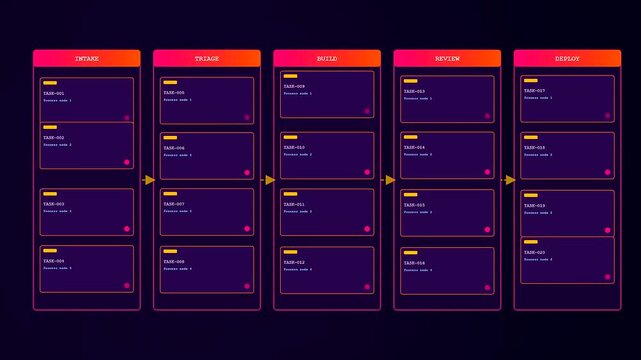
A digital workflow map displaying complex administrative task progression in multiple sections with illuminated rectangular frames and neon glowing accents against a deep dark purple environment
00:06
HD
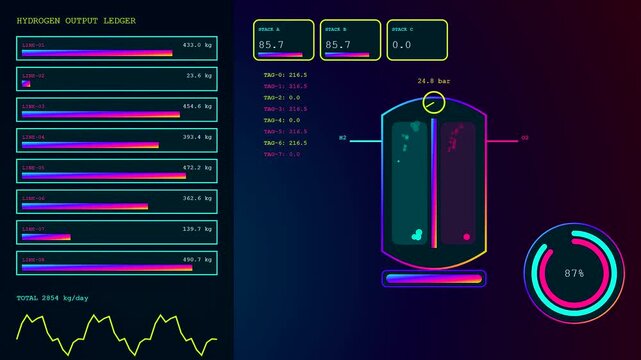
Digital displays showing hydrogen electrolysis data in a dynamic monitoring system with fluctuating charts and glowing interface panels presented as a continuous streaming information sequence
00:06
HD
Analyzing DNA structure, forensic research, genes and genetic disorders, science. DNA molecules analysis, biochemistry, statistics in graphs and charts
00:15
HD
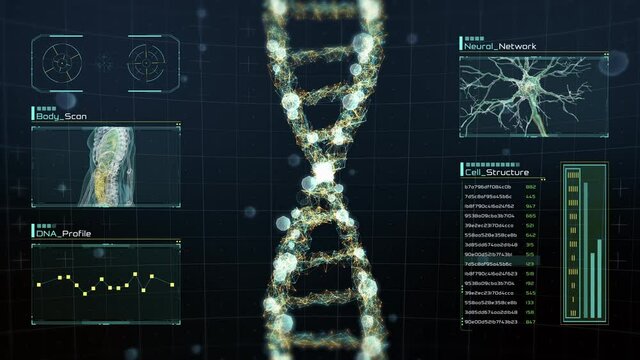
Rotating digital DNA strand on futuristic display with infographics, charts and graphs. Analysis of DNA amino acids, molecules, neuronal activity and genes for medical research and science.
00:15
HD
Digital displays showing sentiment analytics as dynamic graphic charts with glowing neon lines and colorful chat bubbles moving across three separate panels in a sequence
00:06
HD
Digital servers telemetry monitoring interface with neon glowing bar charts and circular data nodes showing abstract network traffic patterns in a dark fluid motion sequence
00:06
HD
A sequence showing synthetic perception as fluctuating digital data graphs with oscillating wave patterns and layered bar charts moving across a dark screen panel display
00:06
HD
Dynamic motion depicting increasing bar chart data visualization for business growth analysis in a modern digital environment.
00:10
HD
Horizontal timeline infographic with five animated steps milestone roadmap presentation template
00:10
HD
Digital staffing allocation interface showing multiple colorful radar charts and data points on a dark screen as the glowing lines flicker in a rhythmic sequence
00:06
HD
Fiery Phoenix rising from ethereal flames, symbolizing rebirth, transformation, and resilience in dynamic video sequence
00:07
HD
Animated MVP launch infographic. Product development. Lean startup. Looped HD info chart template video on white with alpha channel transparency. Interactive flowchart animation with 4 step sequence
00:22
HD
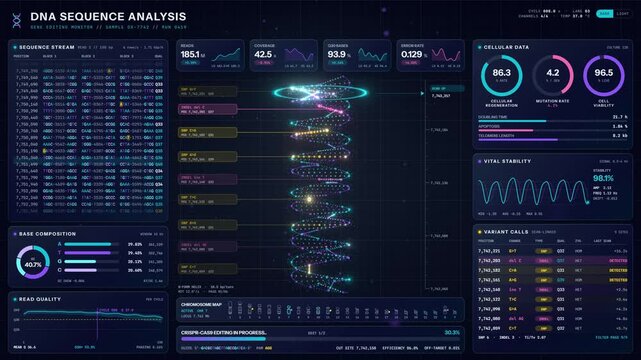
DNA Sequence Analysis
00:10
HD
Displaying vibrant engagement analytics dashboard screens showing line charts with rising neon arrows and changing numerical data values in a dark digital interface graphic style sequence
00:06
HD
Loopable: Genetic mapping DNA sequence analysis 3D abstract background with randomly changing DNA components and blue rays. Big genomic data analysis concept.
00:20
HD
Healthcare professional smiling initiating holographic charts animating for monitoring health data
00:15
HD
Digital empathy networks visualize flowing liquid gradients encased in illuminated teardrop icons alongside flickering binary sequences and moving wave line charts shown on a dark computer interface
00:06
HD
DNA Genomes Sequencing, Deoxyribonucleic Acid Genetic Map and Genome Sequence Analyze. Scientific Animation of Genetic Graph showing ACGT values. Loopable
00:15
HD