A link to set your password has been sent to: To access your purchases in the future you will need a password.
Create without limits — unlimited downloads, plus powerful AI editing
New filters added
Sort by

188,049 results for progress chart in videos

Smart city network showing big data communication and financial charts in downtown Chicago with futuristic digital overlay and information graphics connecting buildings
00:11
HD
AI SEO assistant data, Futuristic digital finance growth chart data analysis technology background neon green glowing line graph stock market business success trend
00:06
HD
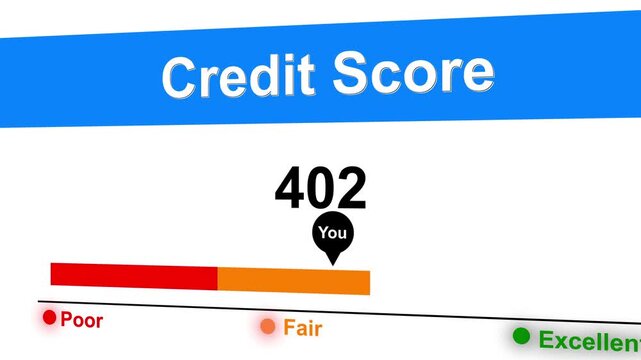
Animated credit score level Fair personal credit score, credit score meter with pointer. Financial report bar chart and increasing counter,
00:10
HD
Up arrow animation on green background. direction arrow icon motion. Up arrow isolated. swipe up pointing video footage-4k green background icon animation
00:10
HD
Rising arrow graph digital growth concept with blue glowing chart and upward trend showcasing futuristic data visualization and digital progress in business technology sectors
00:09
HD
A vibrant red bar graph with a sharp upward trending curved arrow against a solid black background representing financial success and economic advancement
00:10
HD
Business Success Reports And Growth Stats Bars On Screen Background
3d business infographics with rising arrow and bar stats appearing, symbolizing growth and success, with glitch and noise digital ef
00:07
HD
3D animation of growing histogram. Hi tech charts with grid. Digital display with stock market charts. Camera movement with depth of field. 4K high quality animation
00:10
HD
3D glowing blue line graph progress animation with smooth camera tracking and data motion rising up on dark blue background. 4K animated chart for profit visualization, business growth, and market up.
00:17
HD
Simple curved arrow rising to the right growth progress and direction animation, Minimal upward curved arrow animated
00:06
HD
graph chart business progress up and down on a dark teal grid background chart line curve Business Success growth graph animation
00:15
HD
Business profit income and capital charts and graphs diagram seamless and loopable concept
00:16
HD
Real time performance monitoring dashboard with animated bar charts and key business indicators.
00:11
HD
Symbolizing rising profits, success, and positive business performance. Business steady growth concept with rising progress bar chart and upward arrow.
00:10
HD
Animation of a glowing financial bar chart overlay on a black background. Digital trading dashboard UI element, stock market revenue and business growth concept.
00:10
HD
Business Sales growth chart overlay. finance progress bar plotted line showing companies growth. Financial line growing graph animation.
00:10
HD
Glowing bar graph rising showing financial growth and success in a modern digital environment chart business
00:06
HD
white color bar chart with growing business concept hi tech technology chart with a grid black stock market background
00:20
HD
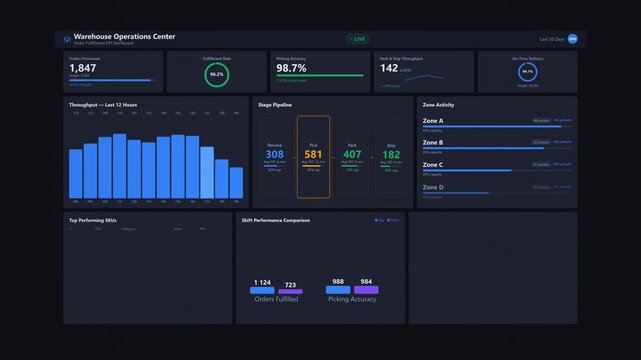
Warehouse order fulfillment dashboard: animated inventory operations tracker with pick rate metrics, shipment status breakdown and daily throughput performance visualization
00:10
HD
Advanced data analytics dashboard display. Business and financial investment. HUD infographic of financial. Information reports of business strategy for investment. Technology data analysis.
00:25
HD
Business growth concept in allusive graph chart showing marketing sales profit increasing to target . Excellent financial status of corporate business rise up.4k animation video graph
00:10
HD
High-definition animation of digital blue bar chart showcasing business growth and market trends. Hi-tech grid, dynamic camera movement emphasize upward trajectory of success and financial progress.
00:16
HD
Diverse business professionals analyzing complex data on large futuristic digital display screens in a modern control room environment showcasing financial charts and graphs with glowing blue
00:10
HD
Dynamic stock market chart with candlestick patterns and real-time financial data on a digital screen ideal for illustrating investment trading and economic analysis
00:08
HD
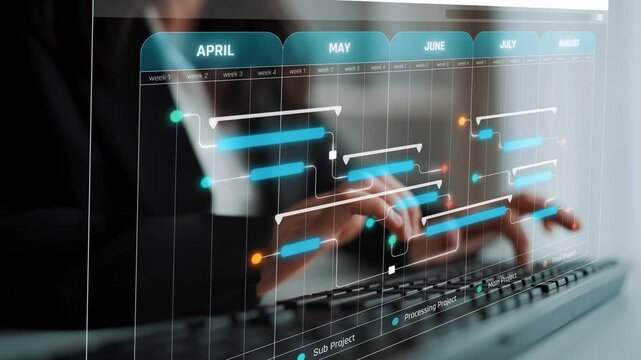
Business professional working on project management software displaying timelines and schedules on a transparent screen in a modern office environment Sigmoid
00:10
HD
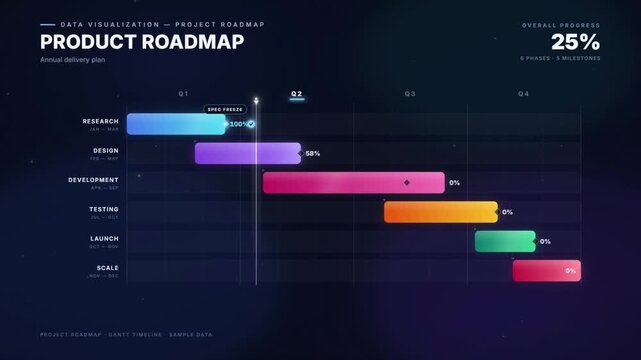
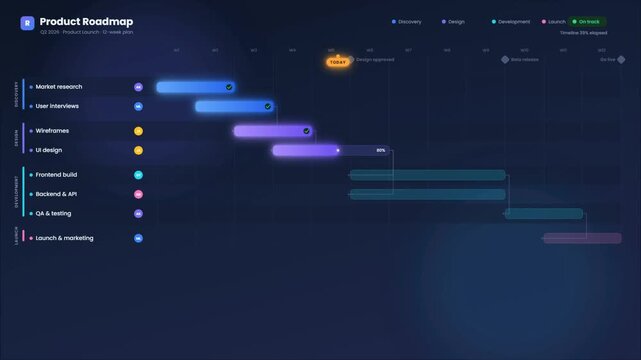
Animated Gantt chart project roadmap timeline visualizing development phases and progress tracking
00:12
HD
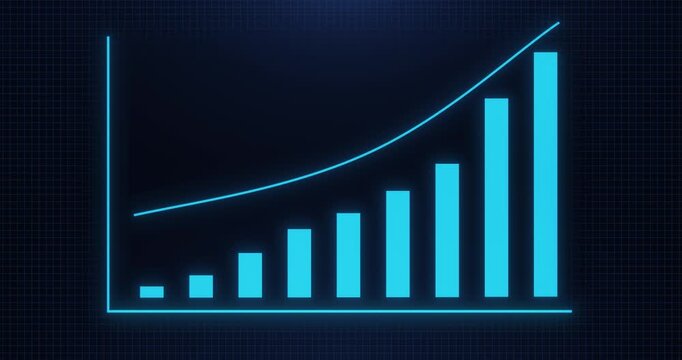
Blue animated business growth bar chart with rising trend line
00:10
HD
Rising bar chart with glowing line graph, seamless loop animation of business growth analytics, financial success concept, modern digital background
00:07
HD
Glowing blue line graph progress animation with smooth data motion rising up on dark blue background. 4K animated chart for business growth, profit visualization, and market up.
00:17
HD
Animated futuristic linear histogram, graphs and charts on white background, user screen dashboard or interface with graphs, lines, surfaces, motional and colorful diagrams, animated dashboard, market
00:10
HD
Animated bar chart with rising trend arrow showing business growth and financial success
00:05
HD
Top Down View Of Diverse Team Of Business Professionals And Managers With Laptops Entering The Conference Room And Sitting Behind Table To Discuss Financial Data And Sales Reports In Corporate Office.
00:21
HD
A blue digital stock chart shows an upward trend, indicating growth and positive performance.
00:05
HD
Business growth concept in  graph chart showing marketing sales profit increasing to future target .  growing business concept. Clean Hi-tech style technology chart with a grid.
00:09
HD

A blue stock market graph with an arrow pointing upwards, indicating growth and progress in the financial industry.
00:10
HD
Abstract digital arrow pointing upwards, representing growth and progress in the future
00:08
HD
Holographic trading screen with red lines candlestick chart and glowing bar graph over dark digital background, showing futuristic Data Visualization, Tech Finance setup
00:05
HD
Animated business graph chart with upward trend on grid line background.
00:08
HD
Flat animation of a laptop dashboard with pie chart, bar chart, checklist indicators, progress bar, and rising line graph, representing data analytics, task progress, and business growth tracking.
00:10
HD
Animated financial stock market chart with a rising graph and trend line, symbolizing business growth, success, and profit. Investment and economy data visualization motion graphics video footage.
00:10
HD
Inflation recession and depression crisis charts and graphs diagram seamless and loopable concept
00:16
HD
Faceless senior executives early morning boardroom meeting, silhouettes soft sunrise light glass windows, blurred city skyline close-ups of hands pointing financial charts tablets, reflective glass
00:05
HD
Glowing blue holographic chart rising above man's hand. Business growth visualization. Digital financial graph showing upward trend. Technology-driven progress concept
00:05
HD
Growing graph with diagram and connected points on a black background. Concept of profit growth and volume increase. Visualization of goal achievement. Cg
00:30
HD
Hands typing on laptop with data charts and security icons overlay showing analysis, statistics, and technology insights in a dark modern workspace Gluon.
00:10
HD
Modern business data analytics dashboard animation showing high growth with 3D bar chart display
00:10
HD
Arrow up trend chart stock exchange asset, diagram investment capital gain world money economic growth, financial graph chart, market report
00:20
HD
Set of infographic and data visualization elements for statistic and financial reports. Analytical dashboard with charts and diagrams  on white background. 4K animation.
00:06
HD
Abstract arrow business graph icon animation background. arrow rising transparent channel. Abstract arrow growth chart of economy icon animated down to up arrow animation direction animation.
00:10
HD
Product roadmap timeline with gantt chart bar and project phase schedule on a dashboard
00:12
HD
Skyscrapers with upward-trending financial chart and rising arrow, symbolizing business growth, investment success and real estate asset value. Ideal for property investment, financial market concepts
00:14
HD
Project Manager Plans Team Schedule
00:15
HD
Animated white bar chart graph with rising trend arrow on a clean black background, representing financial growth, business success, data, analysis, market expansion, and positive economic progress
00:10
HD
Business steady growth concept with rising progress bar chart and upward arrow.  Symbolizing rising profits, success, and positive business performance.
00:10
HD
Stock market chart showing growing trends on a digital screen
00:05
HD
Data Analyst analyze Data Financial Dashboard and Touch screen Monitor.
00:13
HD
Hand placing a bar on a chart while displaying various types of graphical representations, concepts of data analysis, financial growth, and business strategy
00:17
HD
Black color arrow rising transparent channel. Abstract arrow growth chart of economy icon black color animated down to up arrow animation, on a white background, direction animation,with video.
00:06
HD
Businessman hands typing on a laptop with a glowing hologram bar chart animation on the screen, Holographic online business growth data analysis and financial progress in a dark office
00:06
HD
Blue financial stock market graph showing rising bar charts and upward arrow for business success and profit growth
00:10
HD
Percentage 100 percent pie chart progress bar loading symbol circle.
00:10
HD
Blue stock market graph, a business background with an upward bar chart and financial data on a dark blue banner for trading or business growth concept.
00:10
HD
3D bar graph with an upward trending arrow indicating financial growth and success business finance
00:05
HD
A powerful dark tech interface with neon blue accents and icons symbolizing business integrity, ethical standards, and a transparent corporate network.
00:10
HD
Interactive Data Visualization Dashboard with Project Management Metrics and Analytics for Business Review and Planning in Modern Office Environment Gluon.
00:10
HD
Within the digital space, a substantial flow of stock exchange data is underway.
00:15
HD
Financial graph chart, market report, arrow up trend chart stock exchange asset, diagram investment capital gain world money economic growth
00:20
HD
Business team analyzing financial data projected on a futuristic interactive touchscreen interface, working together using innovative technology for investment strategy and market analysis
00:05
HD
Dynamic financial growth bar chart animation featuring rising green columns and upward trending arrow representing annual business success and economic development projections from 2022 to 2027 period
00:10
HD
Industrial business concept with rising financial graph overlaying oil refinery plant at night. Symbolize increasing oil prices, refinery operating costs and growth in global power and energy sector.
00:18
HD
Arrow up business graph icon animation. Increasing business growth chart animation. Going up business graph concept.
00:10
HD
2026 financial goal business growth planning investment future strategy success rocket lifts bar chart arrow upward showing ambitious planning and investment leading to measurable business growth
00:05
HD
Digital data graph with glowing blockchain network and modern finance technology background
00:10
HD
graph chart business progress up and down on a dark teal grid background chart line curve Business Success growth graph animation
00:15
HD
Minimal flat animation of a laptop displaying a rising data chart with incoming data lines and a statistics icon, representing analytics, data analysis, and business performance insights.
00:10
HD
Self drawing line animation Productivity bar chart with gear continuous one single line drawn, Graph going up with an arrow, business concept animation video
00:05
HD
Neon Glowing Upward Growth Graph Chart on Black Background Minimalist Concept
00:08
HD
Business growth concept in graph chart showing marketing sales profit increasing to future target, growing business concept, hi-tech style technology chart with a grid, arrows axis, 4k animation
00:16
HD
Business growth concept in graph chart showing marketing sales profit increasing to future target. business graph success Statistics bars columns growth animation arrow on white background.
00:10
HD
Business growth roi increase with ai integration system development reduce cost improve efficiency successful corporate strategy innovation project management strategic planning corporate progress
00:05
HD
Animated financial bar chart with rising trend line arrow showing business growth, market success, profit increase, and positive economic performance on a clean minimalist black background overlay
00:06
HD
Graph diagram up icon, business growth success chart with arrow, business bar sign, profit growing symbol, progress bar symbol, growing graph Clean Hi-tech style technology chart
00:10
HD
Business partnership coworkers using a tablet to analysis graph company financial budget report and cost work progress and planning for future in office room.
00:11
HD
Two multiracial business men working with documents computer talking holding paper checklist analyzing chart graph businessmen talk efficiency of job males review agenda diagram progress in office
00:11
HD
Neon blue line graph and bar chart showing upward trend on dark background business
00:05
HD
Glowing financial chart with neon lines in digital style on dark background, concept of data analysis and market trends
00:10
HD
Project Manager Reviews Detailed Gantt Chart On Computer
00:24
HD
Digital line graph tracks upward moving corporate revenue. Interactive line graph demonstrates successful financial forecasting. Economic growth concept with corporate line graph.
00:10
HD
arrow rising transparent channel. Abstract arrow growth chart of economy icon black color animated down. business line animation. Abstract glowing neon line business graph growth arrow
00:10
HD
Animated rocket achieving goals on an upward path, marking successful steps
00:10
HD
Hand guides upward trend line. Fingers steady, confident gesture. Businessman projects growth visually. Ideal for finance or strategy presentations. Focus on clarity and forward momentum
00:05
HD
Complete 80 percent loading represented by a bright blue neon circular progress bar on black percentage
00:06
HD
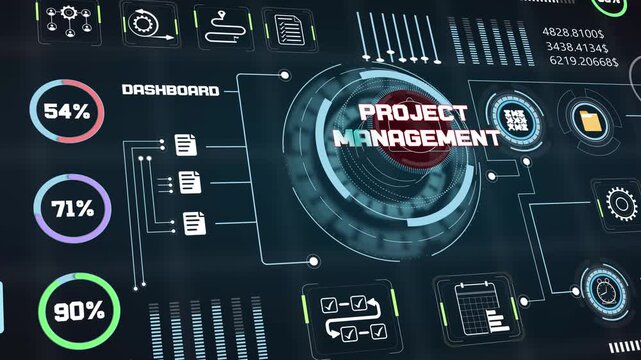
Futuristic project management dashboard display with glowing digital data charts and interactive financial analytics interface on a dark high tech background loop
00:15
HD
A captivating visualization of dynamic financial growth featuring rising graphs against a city skyline backdrop, representing economic trends and market insights. Copula
00:10
HD
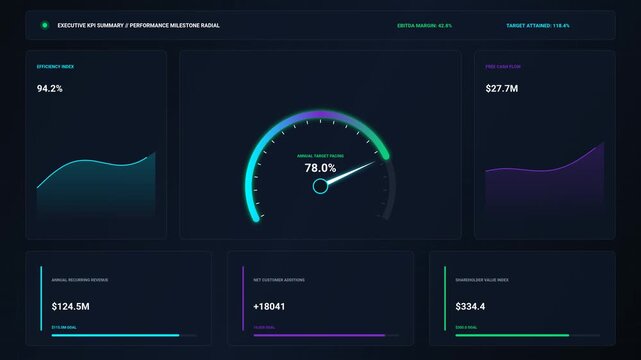
Modern Business Intelligence KPI Dashboard with Radial Performance Gauge
00:10
HD
Animated money meter indicator showing a financial progress and growth concept with copy space. Suitable for business, investment, savings, finance analytics, and economic visualization projects.
00:15
HD
Minimalist line animation of a rising bar chart and a medical protection shield. Perfect for healthcare business growth, medical cost inflation, and health insurance concepts
00:11
HD
Minimal Loading Bar Animation with Progress Indicator. UI Loader, Buffering, Processing, Digital Interface and Technology Concept in 4K
00:06
HD
Futuristic Animation of a Glowing Line chart Rising Upward with a bright Arrow.  Multiple dynamic lines and tracking point move up on dark blue grid background, Data Analytics and Business growth,
00:12
HD