A link to set your password has been sent to: To access your purchases in the future you will need a password.
Create without limits — unlimited downloads, plus powerful AI editing
New filters added
Sort by

1,305 results for infograph in videos

Did you really mean: infogram
Business professional creating organization structure chart with team hierarchy and workflow planning, representing human resource management, corporate structure and leadership strategy for infograph
00:10
HD
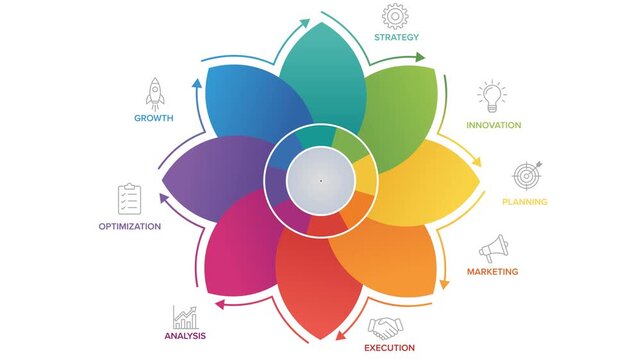
Business Growth and Planning Infographic,  Animated Infographic
00:05
HD
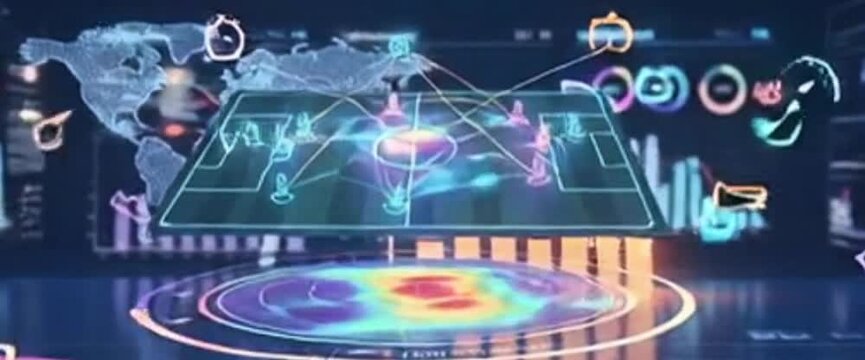
Detailed macro close-up of 3d virtual football pitch showing moving glowing neon tactical lines and strategy.
00:10
HD
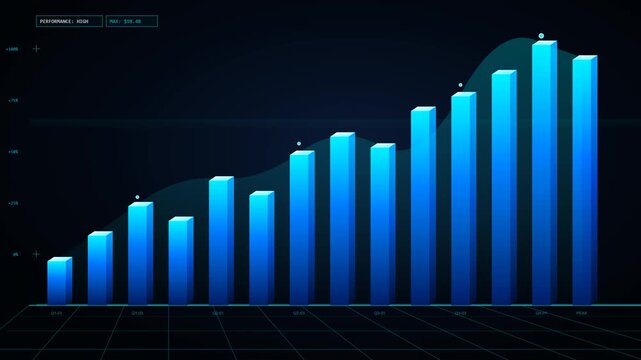
Animated Futuristic 3D Bar Graph and Trend Line Data Visualization HUD Loop for Financial Growth Analytics
00:05
HD
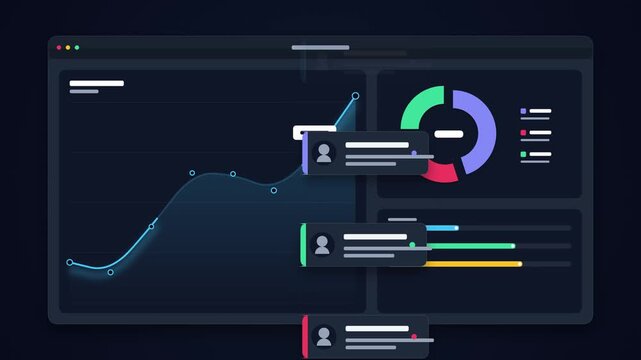
Digital business dashboard displaying revenue growth and projections
00:15
HD
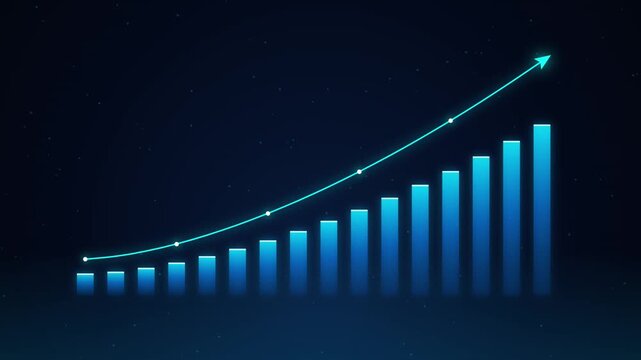
Animated financial bar graph with growing upward trend line and bright cyan blue glowing neon bars rising on a dark technology background symbolizing business success profit and corporate market analy
00:10
HD
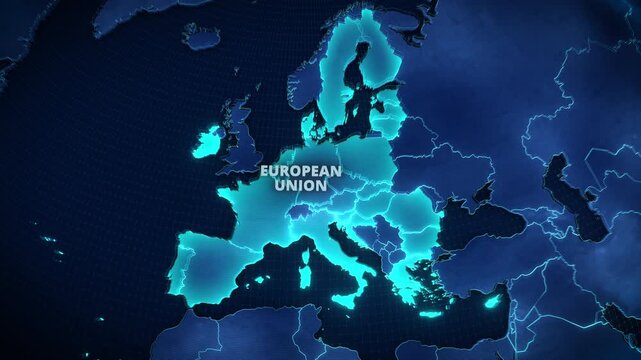
3D Map of the European Union with Glowing Cyan Member States on Dark Blue Background, Modern Geopolitical Infographic for Corporate Presentations and Broadcast News Graphics.
00:12
HD
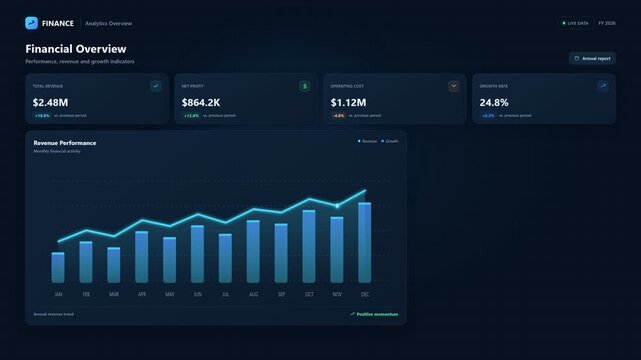
Financial data dashboard interface with animated business charts
00:15
HD
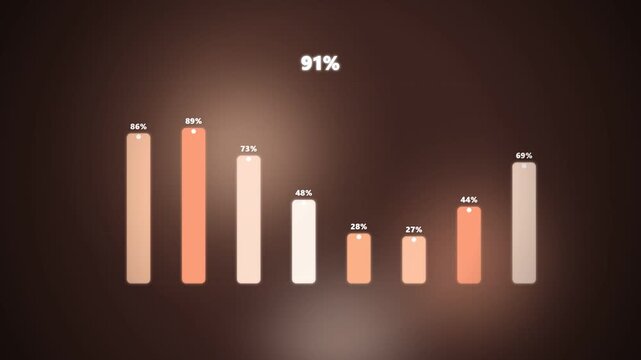
Animated 3D bar chart with percentages, glowing financial data infograph, modern business analytics motion graphic
00:12
HD
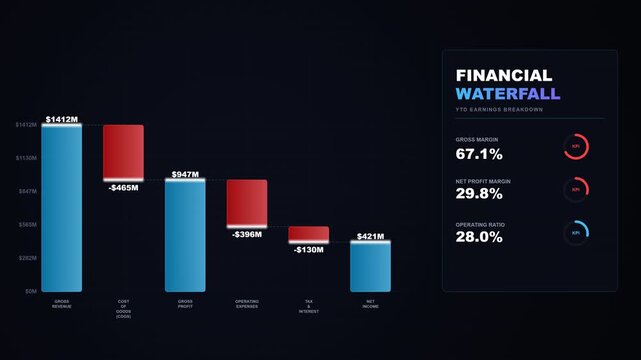
Corporate financial waterfall chart animation showing revenue analysis and earnings report metrics with blue and red data bars on dark background for business presentation videos
00:10
HD
Tech-HUD Element Digital
00:08
HD
Financial growth bar chart with upward line graph, glowing blue business data visualization screen, corporate stock market success graphic
00:07
HD
A modern laptop displaying business financial charts and data analysis on a wooden office desk.
00:20
HD
Minimalist Abstract Blue Data Visualization Bar Chart
00:11
HD
Animated digital data network concept diagram with glowing nodes and interconnected ui on dark background, for technology and, business presentations
00:16
HD
Dashboard UI Animation with Analytics Charts and Mouse Click on Green Screen
00:15
HD
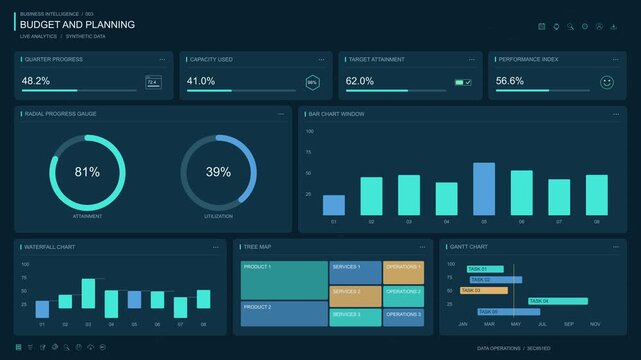
Dark Mode Financial Analytics and Data Dashboard
00:05
HD
Animated Dark Mode Sales Performance Dashboard UI with Growing Bar Chart and Revenue Metrics
00:06
HD
line, glowing, neon, animation, black background, isolated, dynamic, technology, digital, futuristic, 3d animation
00:10
HD
Abstract futuristic 3D bar chart with glowing blue hexagonal pillars on dark background representing data visualization and business growth concept
00:10
HD
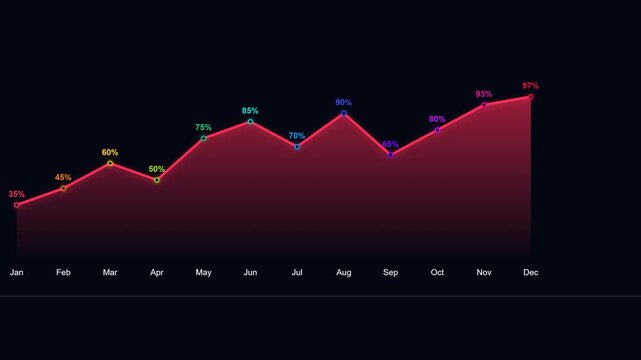
Glowing financial line graph with monthly data metrics on transparent overlay
00:07
HD
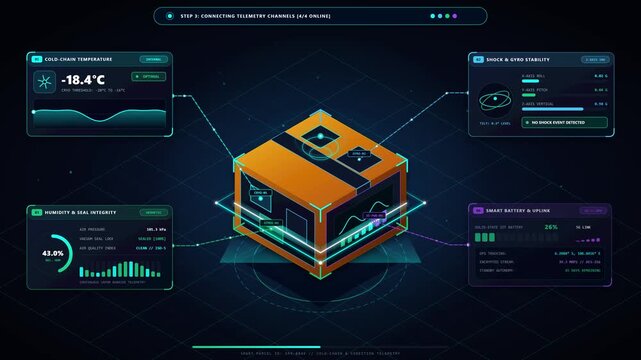
Smart IoT Parcel Box Logistics Telemetry And Cold Chain Tracking HUD
00:10
HD
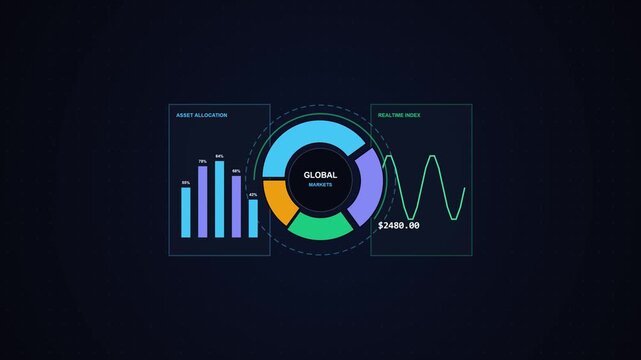
Global Financial Market Dashboard with Animated Pie Chart and Data Analytics
00:10
HD
Clean light mode business dashboard animation featuring financial graphs, bar charts, world map analytics, and data metrics. Ideal for corporate presentations, marketing, and finance projects.
00:06
HD
Financial Growth Analytics Dashboard with Progress Bar Chart and Sparkle
00:10
HD
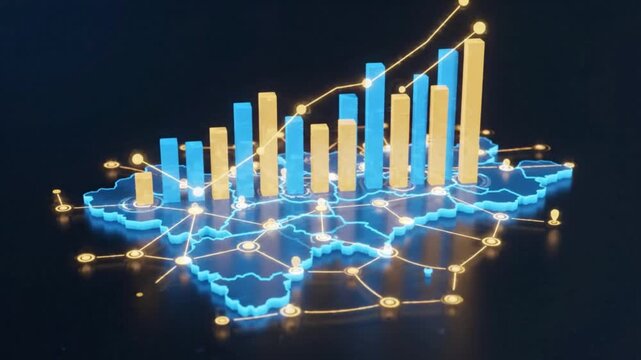
3D Isometric Regional Map with Financial Growth Chart and Glowing Data Nodes
00:08
HD
Futuristic 3D Blue Digital Bar Chart Animation Showing Financial Growth
00:10
HD
Animated Statistics Grid Counter Motion Graphic for Business Data UI
00:09
HD
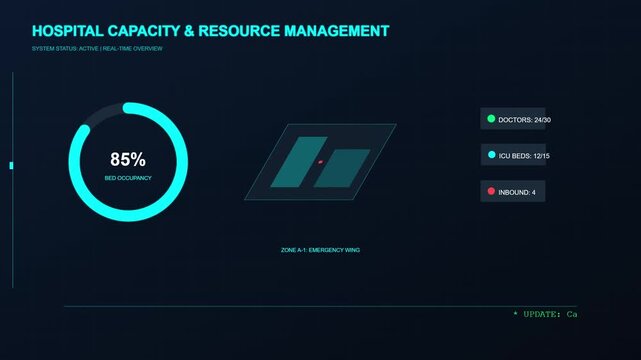
Hospital Capacity and Resource Management Dashboard HUD
00:10
HD
Minimal hud callout line white pointer infograph title lower third 4k 25fps
00:06
HD
Tech-HUD Element Digital
00:08
HD
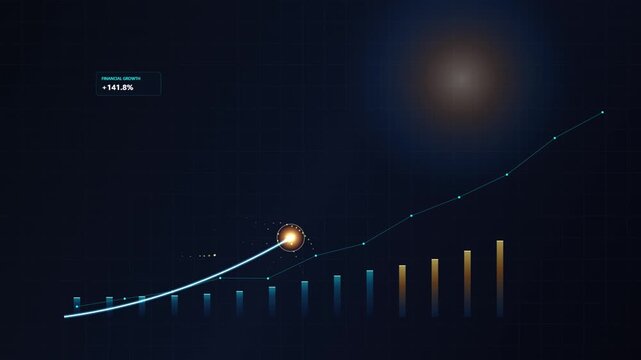
Glowing Blue Financial Growth Line Graph Moving Upward on Black Background
00:10
HD
A modern laptop displaying business financial charts and data analysis on a wooden office desk.
00:15
HD
Candlestick Chart Financial Data Visualization with Moving Average and Floating Prices for Stock Market Trading Analysis on Black Background
00:11
HD
Financial growth bar chart rising over water surface, modern city skyline at dusk background, digital market investment concept, futuristic economy data display.
00:07
HD
Futuristic Financial Bar Chart HUD Motion Graphics Glowing Business Growth Data
00:14
HD
Animated enterprise business dashboard featuring real-time data visualization, call statistics, and financial performance graphs in a modern dark mode user interface.
00:09
HD
Futuristic market analysis digital interface HUD with business intelligence data icons and AI technology visualization on black background
00:15
HD
line, glowing, neon, animation, black background, isolated, dynamic, technology, digital, futuristic, 3d animation
00:10
HD
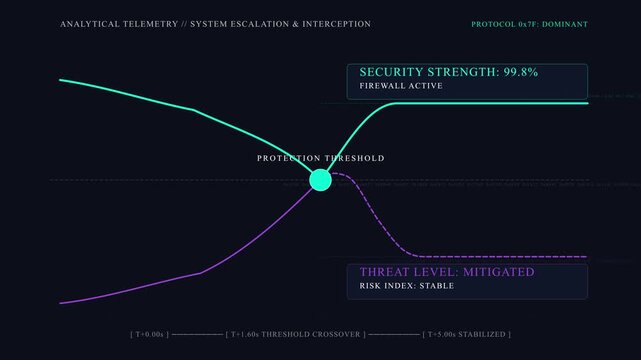
Cybersecurity Threat Mitigation Line Graph Dashboard HUD Animation with Data Telemetry and Network Protection
00:06
HD
4K Animated Dark Mode Business Revenue Line Chart with Percentage Growth Popup Overlay
00:05
HD
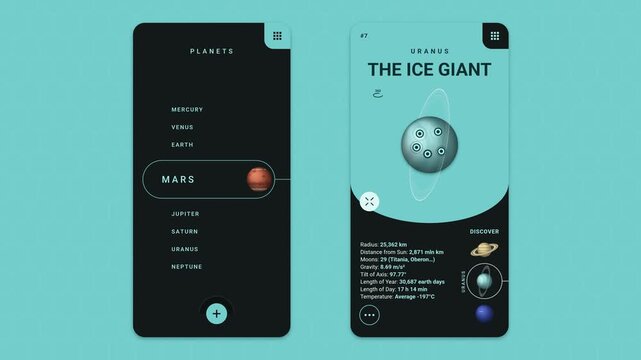
Solar System Planets Mobile App Interface Motion Graphic UI UX Design Animation For Astronomy Educational Presentation And Digital Space Learning
00:15
HD
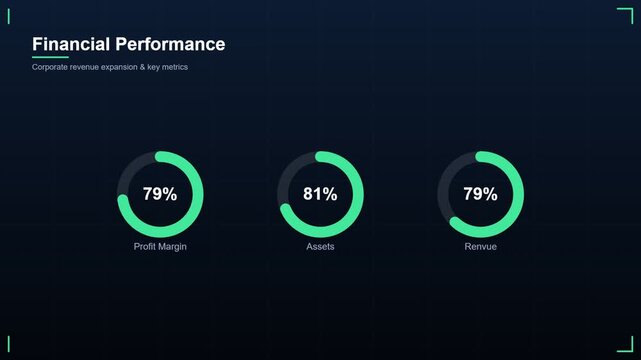
Financial Performance Dashboard Video Motion Graphics, Corporate Analytics Radial Data Charts Displaying Profit Margin, Assets, and Revenue
00:12
HD
Young Asian Girl Writing Business Strategy on Glass Board in Modern Office
00:16
HD
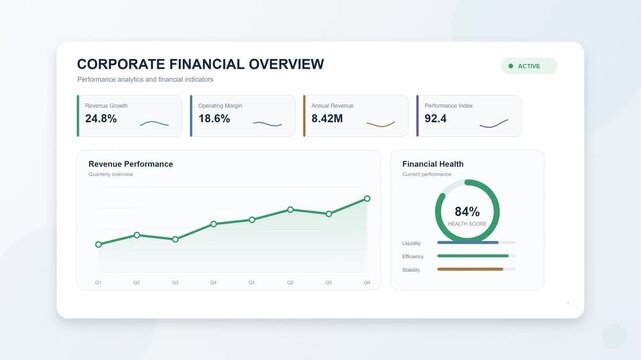
Corporate financial overview dashboard with animated data charts
00:05
HD
Abstract glowing cryptocurrency chart background with neon lines
00:05
HD
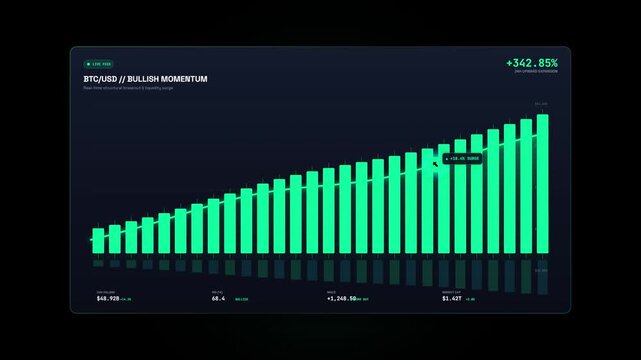
Cryptocurrency financial bar chart showing bullish upward growth trend with green columns on a dark dashboard display
00:10
HD
Isometric Corporate City Growth Seamless Loop Backdrop
00:10
HD
Digital audio equalizer bar chart wave dissolving into particles motion background loop
00:10
HD
Glowing blue neon line graph showing financial growth and stock market rise
00:07
HD
Tech-HUD Element Digital
00:08
HD
Red bar chart illustrating dynamic data growth and loss for financial marketing
00:05
HD
A modern laptop displaying business financial charts and data analysis on a wooden office desk.
00:13
HD
Modern website data visualization tutorial loop, corporate digital marketing dashboard mockup animation, minimalist clean screen metrics layout template vector footage
00:15
HD
3D Sales Percentage Circular Loading Bar Animation
00:08
HD
Futuristic business dashboard with data visualization charts
00:10
HD
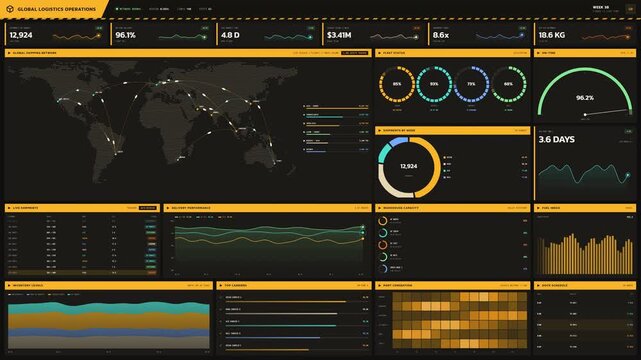
Global logistics operations dashboard with maps graphs and charts
00:20
HD
Futuristic green HUD interface displaying business metrics, data analytics, and digital icons on a dark background.
00:15
HD
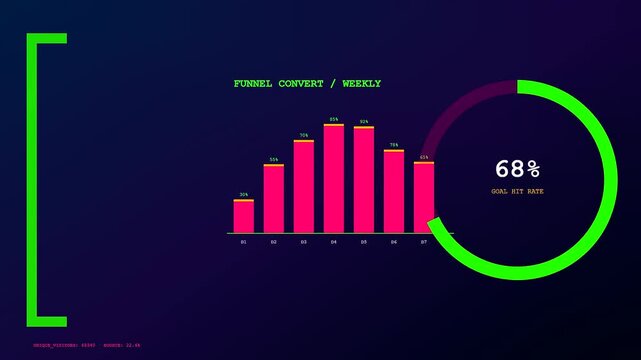
A dynamic and futuristic conversion rate tracker pulses and animates online metrics across a high tech dark cyber security dashboard interface.
00:06
HD
Futuristic Glowing Circular Loading Segmented Progress Bar Animation on Dark Background
00:15
HD
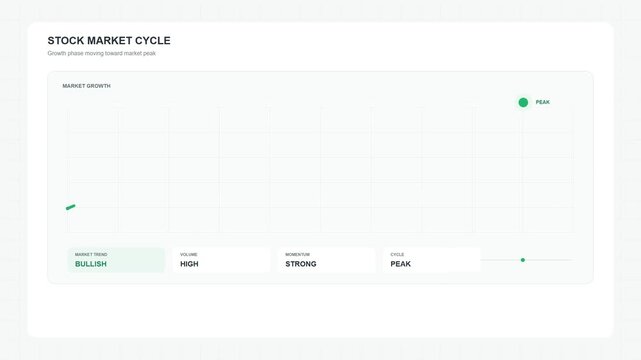
Stock market cycle dashboard displaying financial data and charts
00:15
HD
Circular loading progress indicator animation with percentage counter on black background
00:11
HD
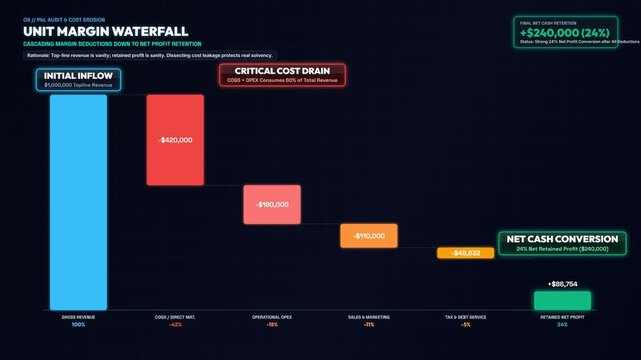
Financial Data Visualization of a Margin Waterfall Chart Showing Revenue Breakdown Expenses and Net Profit Growth with Animated Bars for Business Analysis and Professional Accounting Reports
00:08
HD
Horizontal progress bar with colorful segmented sections for loading process, data measurement, step completion, workflow status, and graphic timeline elements on transparent background
00:05
HD
Futuristic digital interface displaying financial market analytics and business collaboration metrics over an animated green tech grid - 4K loop, market analysis digital hud animation with binary code
00:10
HD
Financial Growth Chart Animation with Rising Rocket and Bar Graph
00:10
HD
Animated Green Exponential Growth Graph for Business and Finance Success
00:15
HD
Glowing Blue Financial Data Chart with Animating Bar Graph and Curved Line Growth Analysis on Dark Grid Background
00:08
HD
3D isometric business growth bar chart and marketplace web element
00:05
HD
Business Data Analyst Working at Desk with Financial Chart Dashboard. Corporate Employee Character 2D Animation.
00:08
HD
Tech-HUD Element Digital
00:08
HD
Financial growth bar chart and rising line graph animation on dark background.
00:10
HD
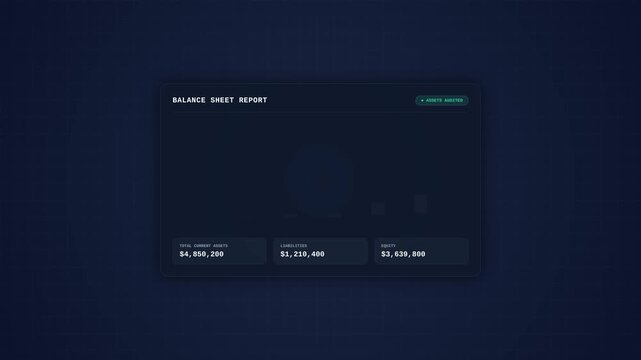
Financial Balance Sheet Report Dashboard showing animated data visualization and growth metrics
00:10
HD
Website app UI infographic dashboard animation, abstract light mode user interface elements analytics loop, modern desktop application data presentation stock clip video
00:15
HD
Glowing blue line chart graph with node points on dark background representing stock market analysis and financial data trend
00:10
HD
Financial dashboard displaying wave and bar charts
00:12
HD
Clinical operations center dashboard with patient vitals and telemetry
00:20
HD
Lead antibody optimization process analyzing therapeutic properties. Refining molecular components. And evaluating performance in varying conditions
00:17
HD
Neon data visualization glowing chart background. video
00:05
HD
Glowing Neon Cyan Line Chart Animation with Moving Light Particle on Dark Background
00:15
HD
Futuristic UI HUD dashboard display featuring animated data visualization charts, neon line graphs, and digital analytics indicators on a dark background for tech and business concepts.
00:05
HD
Circular loading progress indicator animation with percentage counter on green background
00:11
HD
Dark Mode UI Dashboard with Animated Charts and Financial Data Visualization.
00:06
HD
Horizontal progress bar with colorful segmented sections for loading process, data measurement, step completion, workflow status, and graphic timeline elements on transparent background
00:05
HD
Stylized educational 2D animation showing the solar system with eight planets and an asteroid belt revolving around the sun on circular orbits against a starry space background.
00:10
HD
A sophisticated animated waterfall financial chart illustrating sequential increases and decreases in business value with blue, red, and yellow rectangular columns.
00:10
HD
Green dashed curved arrow animation indicating growth and direction on black background
00:05
HD
Digital Audio Equalizer Spectrum Bar Motion Graphic, Abstract Music Frequency Soundwave Visualization Background, Modern Sound Analytics Concept
00:12
HD
Statistics, financial market data, analysis and reports. 4K Transparency alpha channel.
00:30
HD
Business mechanism concept animation with alpha matte.
00:34
HD
Tech-HUD Element Digital
00:08
HD
Document slide up looping video. Green screen.
00:06
HD
AERIAL. Blue tone city scape and network connection concept
00:22
HD
Dark mode financial dashboard animation video, futuristic desktop UI UX business screen transitions, neon data graph analytics statistics looping stock footage
00:15
HD
Creative 3d infograph chart animation in 4K 60fps. Stock growth, business growth animated chart in 60FPS.
00:20
HD
Statistics Data Analysis Business Chart Information on Computer desktop and Mobile phone isometric design animated concept 4K video
00:40
HD
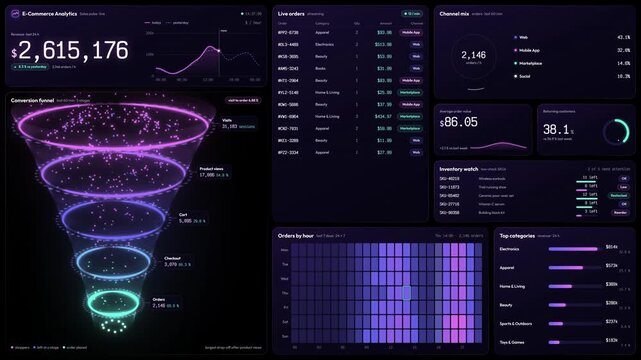
E-commerce analytics dashboard with 3D conversion funnel and charts
00:20
HD
Blue, grey Premium loop background luxury polygonal pattern. gold triangle lines. Low poly gradient shapes polygons design. Black Friday, award Show, Slideshow, Birthday, Event, Party, Music, Fashion
00:10
HD
Glowing financial graph digital background with neon lines. video
00:05
HD
Lifecycle circulation icon with 6 arrows. Circle animation with six parts. Thick flat renew circle. Green color on white background.
00:10
HD