Um link para definição da senha foi enviado para Para acessar suas compras no futuro, você precisará de uma senha.
Receba 10 imagens do Stock com um teste grátis
Novos filtros adicionados
Classificar por

18.509 resultados para speedometer graph em tudo

1.792 resultados em vídeo
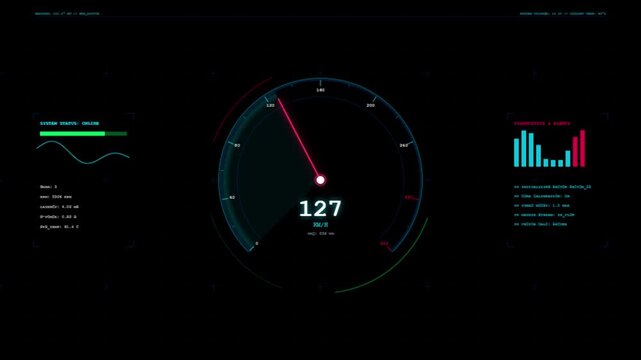
Speedometer dashboard interface with neon glowing gauges and telemetry data display for futuristic vehicle technology
00:10
HD
dashboard speedometer data graph analytics monitor HUD motion graphic
00:06
HD
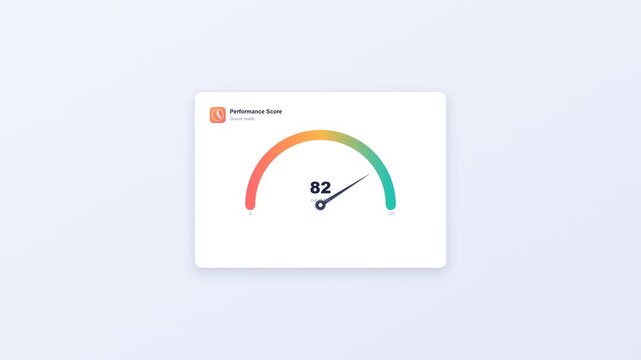
Performance Score Gauge Meter Dashboard Widget User Interface Element with Dial and Arrow
00:08
HD
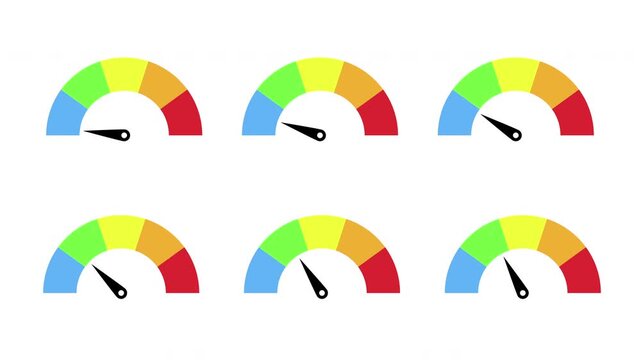
Grid of Six Speed Meters Performance Level Animation
00:08
HD
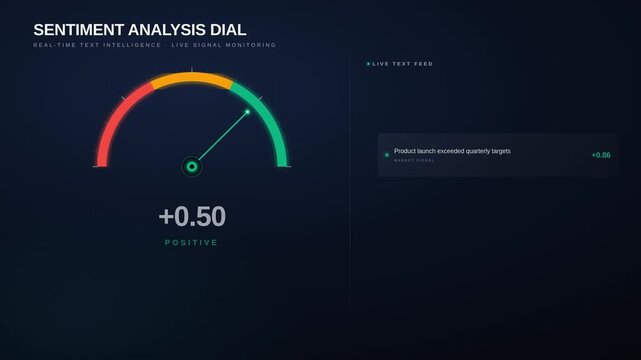
Animated sentiment analysis dial gauge with needle live text feed, for real-time text intelligence, emotion detection, live market signal monitoring dashboard
00:20
HD
Business Data Dashboard Interface with Animated Financial Performance Metrics and Risk Gauges
00:10
HD
Speedometer Needle Fluctuation on White Background Animation.
00:10
HD
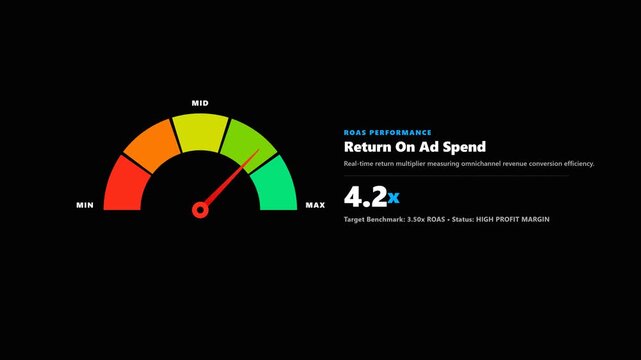
Digital roas performance gauge showing marketing return on ad spend. 4K Video
00:15
HD
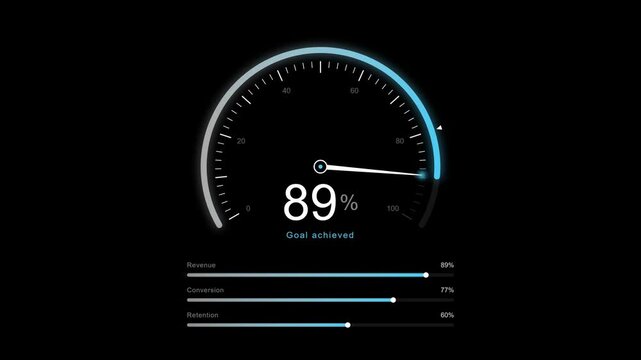
A professional business dashboard infographic featuring a circular speedometer gauge showing thirty-eight percent progress with blue accents on a dark black background for data analysis.
00:10
HD
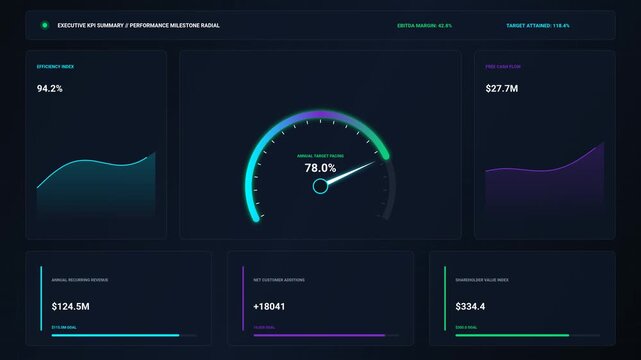
Modern Business Intelligence KPI Dashboard with Radial Performance Gauge
00:10
HD
Digital speedometer gauge with needle pointing upwards on black background, representing speed and performance metrics
00:08
HD
Futuristic HUD dashboard interface with speedometer gauge animation
00:06
HD
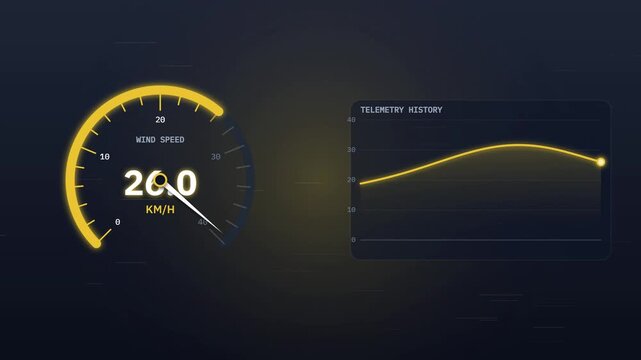
Futuristic HUD digital dashboard showing wind speed speedometer and telemetry history graph with neon yellow glowing elements for weather data tracking
00:10
HD
Performance gauge meter animation showing decreasing efficiency and speed levels with color-coded segments on white background
00:16
HD
Animated speedometer gauge with a sweeping needle with alpha channel
00:10
HD
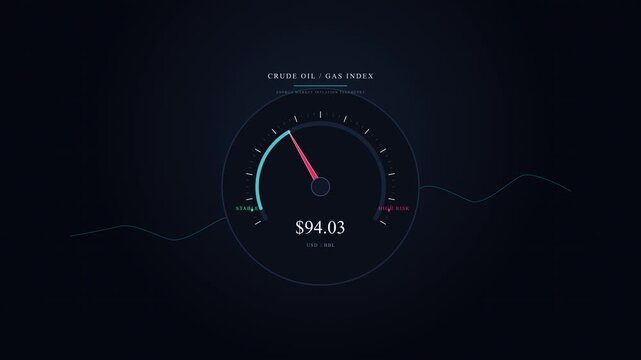
Color gradient motion graphics gauge meter scale showing low to high level indicator dial graphic for risk score presentation on dark background
00:05
HD
dashboard, analytics, technology, ui, ux, interface, hud, data, chart, graph
00:06
HD
Digital gauge showing progress from 1 percent to 97 percent and then slightly down to 95 percent with an upward arrow indicating growth
00:10
HD
Digital speed meter animation, Speedometer Display on Black Background, speedometer HUD UI element animation. The arrow moves realistically.
00:15
HD
Animated Semicircular Gauge Meter Card on Green Screen
00:08
HD
Angled fear and greed gauge with swinging needle seamless loop
00:25
HD
Low-normal-high gauge video animation
00:09
HD
Colorful digital speedometer gauge graphic animation showing high performance and efficiency levels in modern video clip
00:11
HD
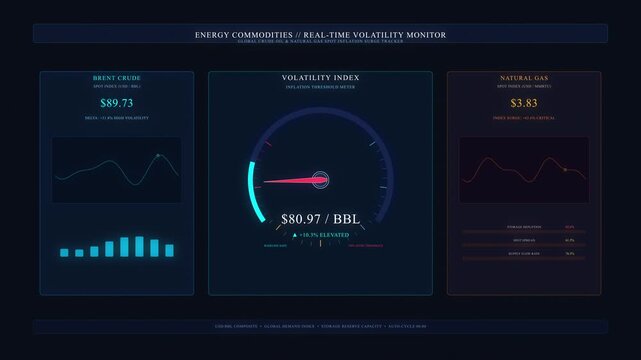
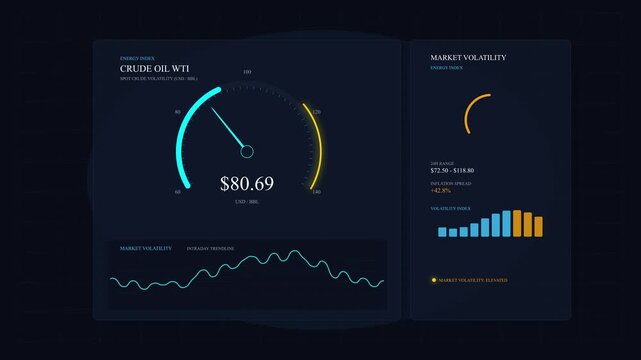
Market volatility gauge graph
00:11
HD
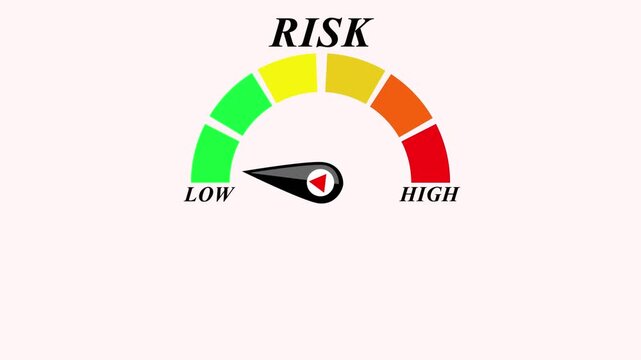
Risk icon on speedometer. High risk meter. Motion graphics.
00:08
HD
Digital speedometer hud motion graphic with dark gauge metrics layout
00:06
HD
Risk speedometer icon or sign of different colors with black arrow. Motion graphic 60 FPS Blue Background Removable
00:10
HD
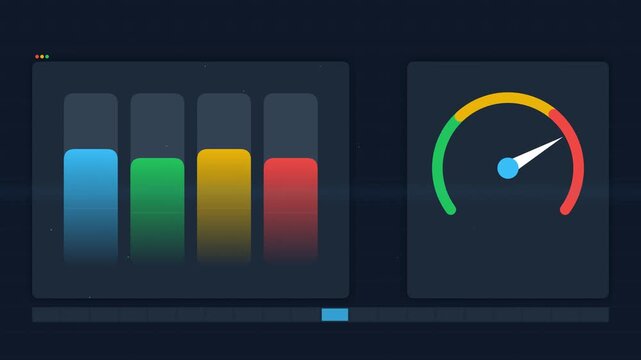
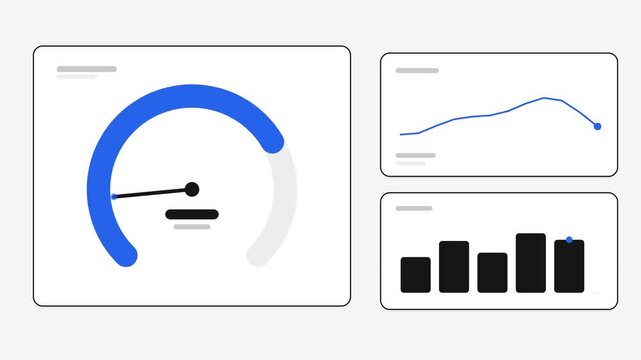
Animated Data Dashboard with Gauge and Bar Charts
00:08
HD
Neon gauge speedometer and bar graph rising arrow animation representing growth success... icon
00:08
HD