Um link para definição da senha foi enviado para Para acessar suas compras no futuro, você precisará de uma senha.
Receba 10 imagens do Stock com um teste grátis
Novos filtros adicionados
Classificar por

171.465 resultados para compare chart em tudo

14.033 resultados em vídeo
ait Comparison Infographic Presentation Template, Business Slide Deck with Data Charts, Product & Feature Comparisons, Pricing Tables and Performance Analysis
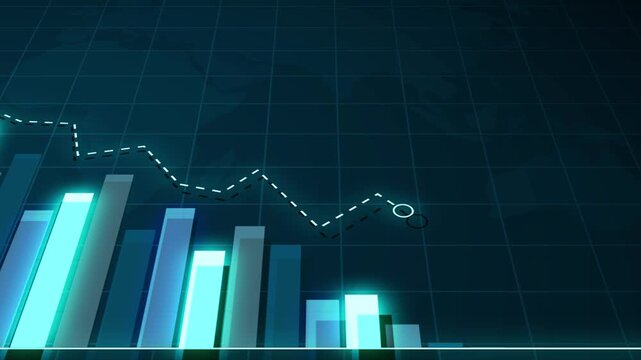
Declining bar chart with downward trend, Blue bar chart with falling line graph decline in business data, finance performance and analytics animation
00:07
HD
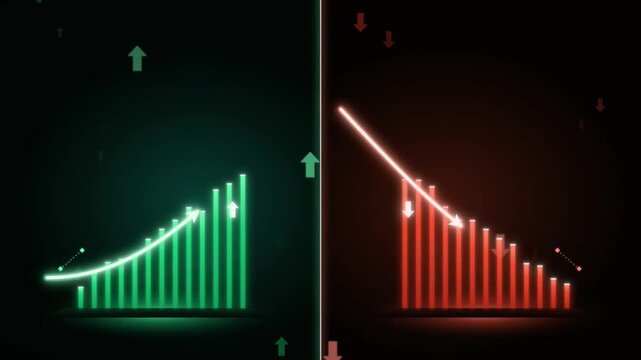
Split screen financial comparison animation with green growth and red decline bar charts
00:15
HD
indt Comparison Infographic Presentation Template, Business Slide Deck with Data Charts, Product & Feature Comparisons, Pricing Tables and Performance Analysis
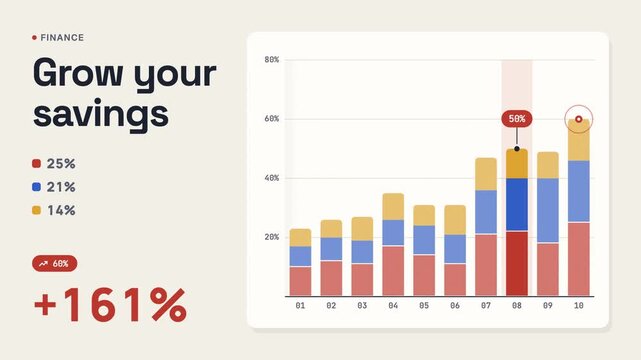
Three finance panels pair savings figures with stacked bar charts, while colored segments and percentage labels compare values across ten numbered intervals
00:10
HD
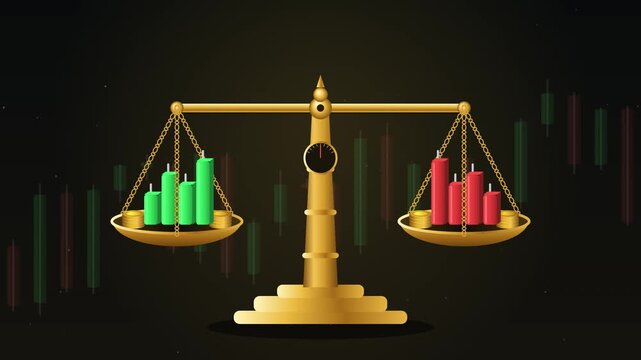
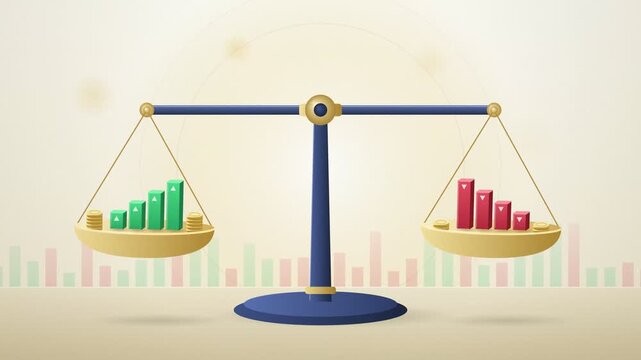
Golden balance scale weighing green and red candlestick charts for financial market risk analysis
00:10
HD
Financial scale balance animation comparing growth green charts and falling red charts with gold coins
00:15
HD
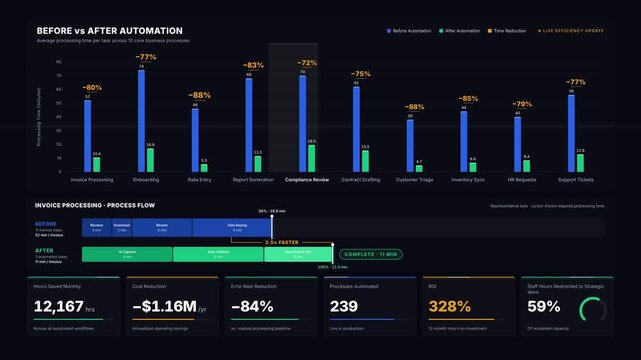
Executive ROI analytics dashboard comparing business process automation efficiency with animated bar charts and live KPI metrics on dark background for commercial creative technology and business use.
00:15
HD
psdt Bento Box Business Infographic Template For Dashboard Report, KPI Metrics, Data Visualization
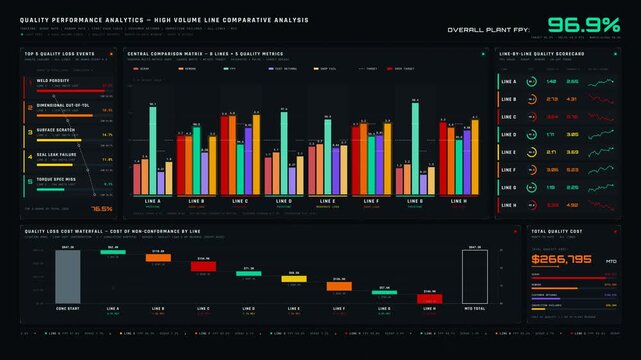
4K production performance dashboard comparing quality losses across high volume lines with animated bar charts and cost waterfall analysis. for commercial creative technology and business use.
00:15
HD
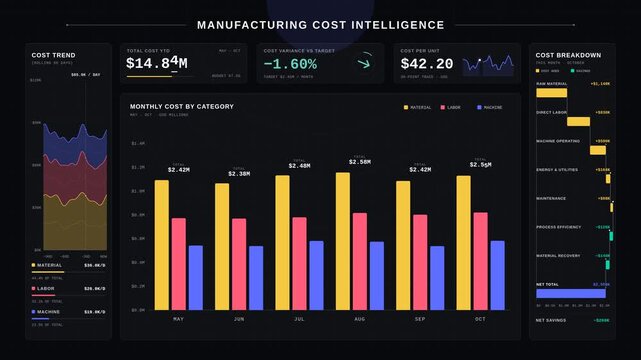
Executive manufacturing cost dashboard comparing material labor and machine operating expenses with animated bar charts and KPI metrics on dark background.
00:15
HD
ait Bento Box Business Infographic Template For Dashboard Report, KPI Metrics, Data Visualization
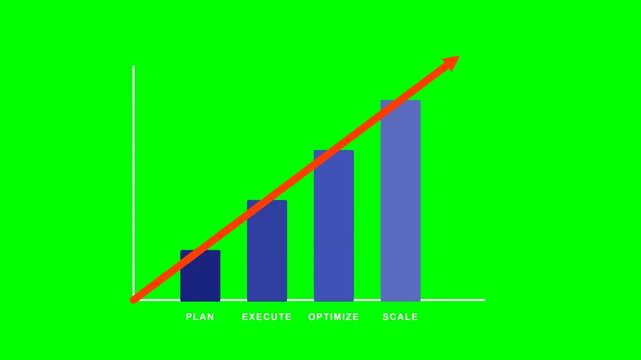
Business Growth Bar Chart Arrow Animation
00:10
HD
Animation of multiple charts visualizing the analysis of large amounts of data
00:14
HD
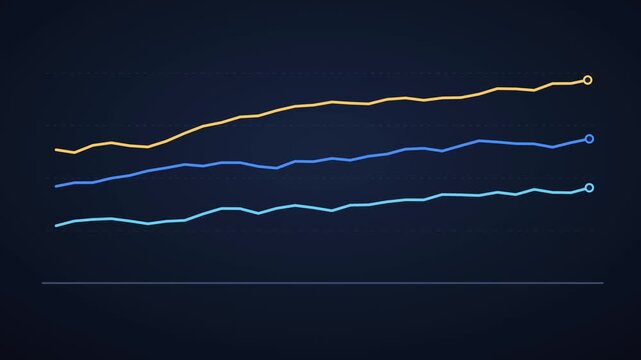
Three trend lines drawing in sequence for multi series comparison
00:12
HD