Um link para definição da senha foi enviado para Para acessar suas compras no futuro, você precisará de uma senha.
Obtenha 3 vídeos ou 25 imagens com um teste grátis
Novos filtros adicionados
Classificar por

4.391 resultados para scatter plot em vídeos

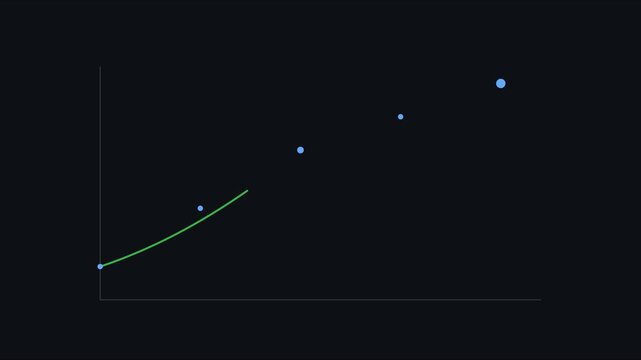
A scatter plot of blue data points against a dark background with a trend line
00:10
HD
Digital line graph tracks upward moving corporate revenue. Interactive line graph demonstrates successful financial forecasting. Economic growth concept with corporate line graph.
00:10
HD
Data visualization scatter plot graph showing statistical analysis and research trends
00:10
HD
Holographic analytics platform panel with a heatmap scatter plot and gauges over purple bokeh
00:22
HD
Tiny dark grey particles drift in a curved stream as a seamless loop
00:10
HD
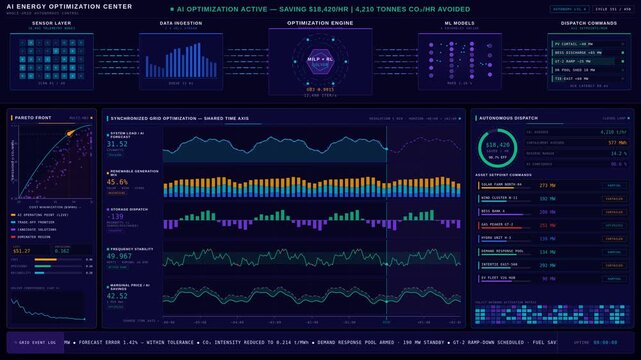
Futuristic AI energy optimization control center with glowing data analytics and autonomous decision dashboard in 4K. professional stock footage for technology, business, and editorial use.
00:15
HD
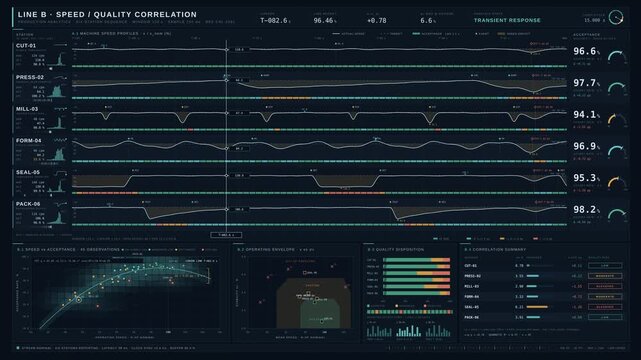
4K production line dashboard comparing machine speeds and quality acceptance rates with waveforms and scatter plots in dark blue interface for commercial creative technology and business use.
00:15
HD
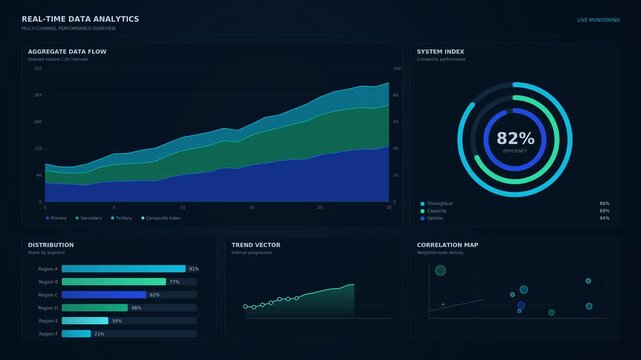
Data analytics dashboard animation, area chart, donut gauge, bar graph and scatter plot building up on dark blue UI screen
00:12
HD
ESG Sustainable Finance Clean Tech Scatter Plot Growth Line Graph Loop L-Shape Copy Space
00:10
HD
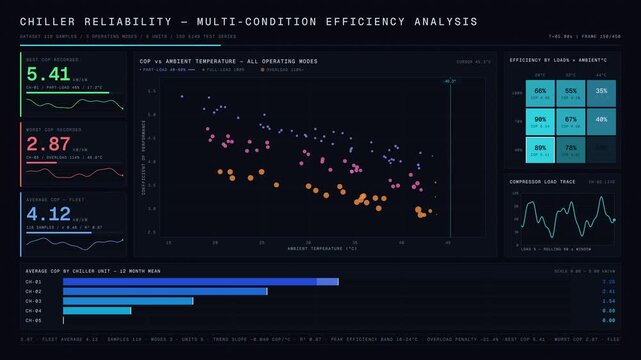
Analyze chiller reliability with an efficiency dashboard showcasing performance across operating conditions featuring interactive scatter plots and heatmaps.
00:15
HD
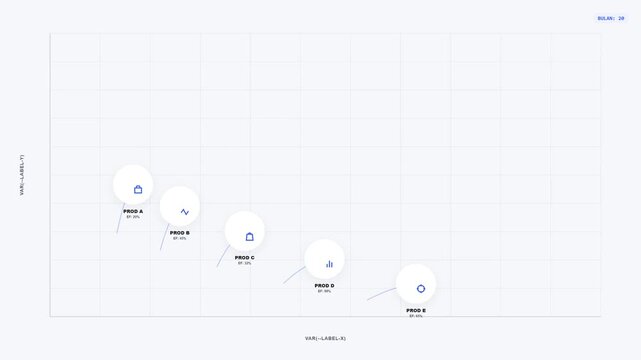
Minimalist abstract scatter plot graph with floating data points and labels
00:06
HD
Data regression analysis chart showing trend line fitting over scatter plot points for statistical modeling and financial forecasting
00:10
HD
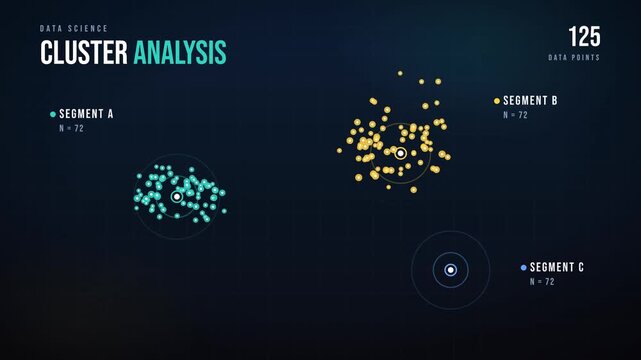
Scatter plot dots clustering into colored groups data visualization infographic
00:12
HD
Business data visualization with circular progress and scatter plots
00:10
HD
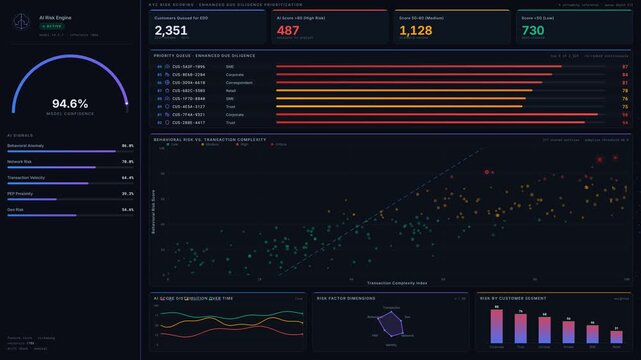
Explore a futuristic AI KYC risk scoring dashboard with enhanced due diligence prioritization, featuring dark mode aesthetics and dynamic data visualizations for financial insights.
00:15
HD
Animated dot scatter plot forming data patterns. Digital particles visualizing big data.
00:10
HD
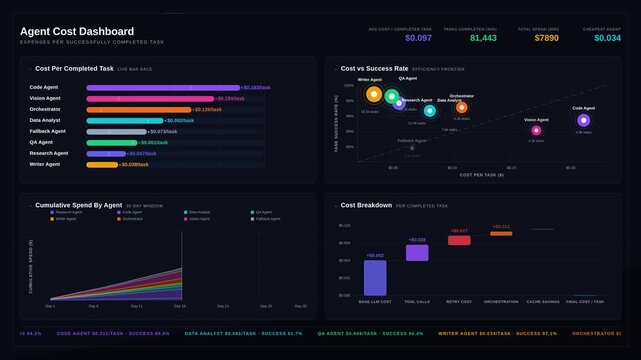
A dynamic agent cost dashboard visualizing expenses per completed task with animated bar graphs and scatter plots in a high-tech interface design. for commercial creative technology and business use.
00:15
HD
Modern Digital Dashboard with Data Visualization and Interactive Controls
00:07
HD
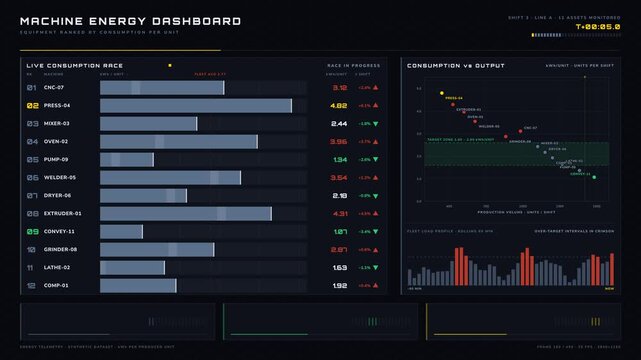
Dynamic machine energy dashboard showcasing equipment ranked by consumption per unit with animated bar chart and scatter plot for performance analysis.
00:15
HD
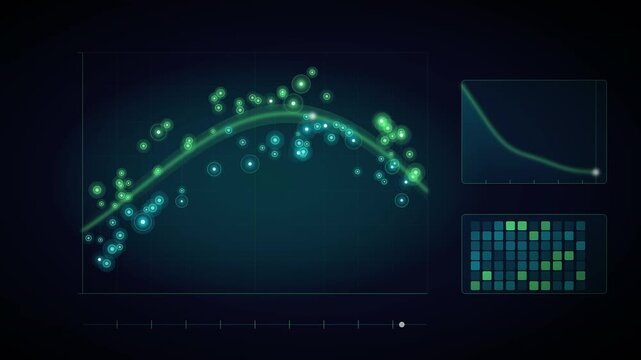
Animated Scatter Plot Showing Data Points Forming a Downward Curve on a Graph.
00:12
HD
Exoplanet Transit Across Star With Light Curve Plotting Animation
00:15
HD
Colored data point clusters with centroids on beige 3D scatter plot
00:30
HD
Blue Scatter Plot Appear Animation Loop Background
00:10
HD
Glowing constellation scatter plot network animation seamless loop, glassmorphism data science and neural network background
00:15
HD
Abstract digital scatter plot showing linear and vertical data trends
00:10
HD
Animated Scatter Plot with Colorful Data Points
00:08
HD
Energy efficiency analytics dashboard features a bubble scatter plot comparing building consumption intensity and savings, with interactive elements and dynamic visualizations.
00:15
HD
Scatter plot dots converging into trend line on black background
00:05
HD
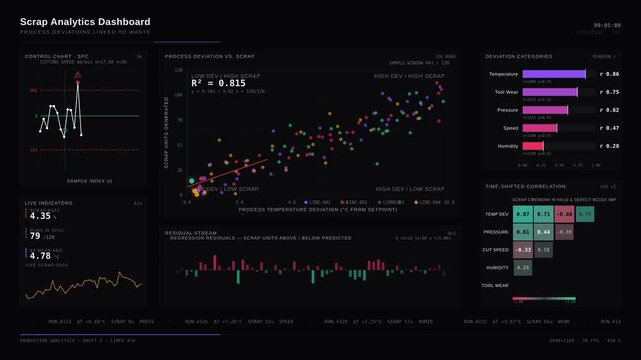
An advanced scrap analytics dashboard visualizing process deviations linked to waste through detailed scatter plots, control charts, and correlation matrices in vibrant colors.
00:15
HD
Anomaly detection interface displaying cluster data metrics with multiple graphical panels showing circular scatter plots and digital scan information on a dark glowing monitor screen
00:06
HD
A scatter plot showing a negative correlation between two numerical variables
00:10
HD
Machine Learning Model Fitting A Curve To Scatter Data While Loss Chart Descends Seamless Loop
00:12
HD
Data analytics scatter plot with trend line: financial growth and statistical analysis visualization animation 4k
00:10
HD
Abstract digital scatter plot on a dark background with curved lines
00:10
HD
Dot particle infographic morphs scatter plot into histogram, donut chart, funnel and world map dashboard
00:15
HD
Dynamic Scatter Plot Matrix Showing Big Data Analytics and Statistical Trends Motion
00:20
HD
Data Science Notebook Code Execution DataFrame Bar Chart KMeans Clustering Model Training Loss Curve Seamless Loop
00:15
HD
Research data analysis motion graphics, scatter plot with regression trend line and magnifying glass scanning data points, heatmap, histogram and progress rings, scientific statistics dashboard, text
00:12
HD
A sophisticated dark-mode healthcare operations analytics dashboard visualizes comparative performance metrics across hospital departments with clear data visualization and animations.
00:15
HD
Finance Risk Data Scatter Plot with Pulsing Radial Effects
00:06
HD
Data Analysis: Residual Scatter Plot for Model Evaluation
00:05
HD
Dynamic motion of a scatter plot with a trend line illustrating high correlation in animated data visualization.
00:10
HD
Cyan Scatter Plot Data Distribution Animation
00:10
HD
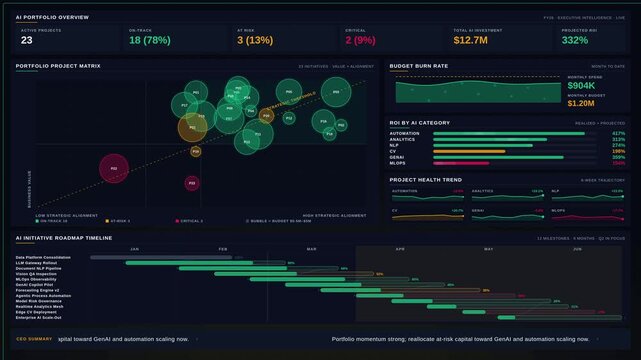
Premium 4K looping AI executive portfolio dashboard animation featuring KPI ticker, project scatter plot, budget burn rate, and roadmap timeline in dark luxury style.
00:15
HD
Abstract Scatter Plot Point Cloud Clustering Into Colored Groups Data Visualization Seamless Loop in bright teal tones
00:10
HD
Dotted Scatter Plot Rising Along Trend Lines
00:08
HD
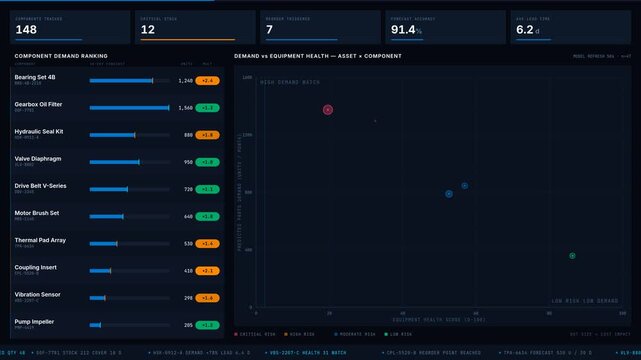
A dark-mode spare parts dashboard showcasing predicted component demand based on equipment health, featuring scatter plots and KPI metrics for effective inventory management.
00:15
HD
Abstract digital scatter plot with green data points on dark grid
00:24
HD
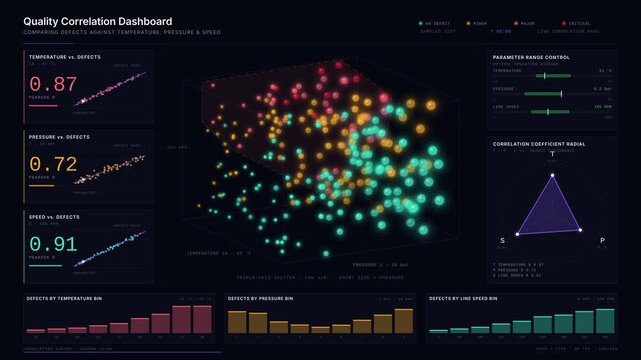
Explore a comprehensive Quality Correlation Dashboard showcasing defects against temperature, pressure, and speed with stunning 3D scatter plots and vibrant color coding.
00:15
HD
2D Scatter Plot Data Visualization with Sequential Blue and Orange Points and Emerging Linear Trendline
00:05
HD
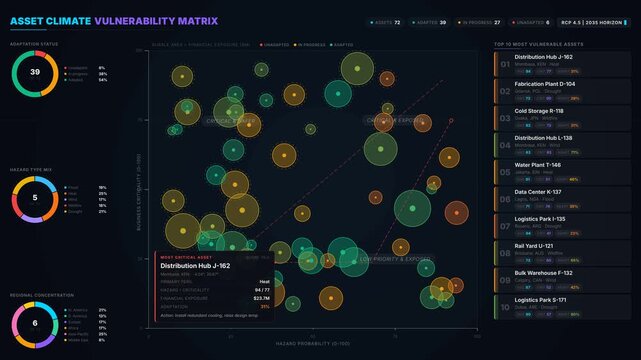
Animated 4K climate vulnerability dashboard featuring a dynamic bubble scatter plot matrix, risk frontier lines, and live data visualization panels on a dark background.
00:15
HD
Black scatter plot with points forming clusters, data analysis visualization loop, transparent background
00:08
HD
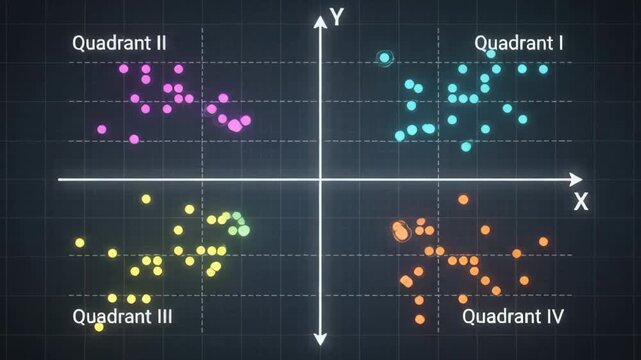
Colorful scatter plot graph illustrating mathematical Cartesian coordinate system with four distinct quadrants on a dark grid
00:09
HD
Abstract scatter plot data visualization with glowing neon dots on dark grid background
00:05
HD
Global Data Network Analytics Dashboard with Emerald Nodes and Animated Scatter Plot Charts
00:10
HD
Minimalist scatter plot graph with white dots on a solid black background
00:10
HD
Digital interface displaying historical data analysis scatter plot
00:10
HD
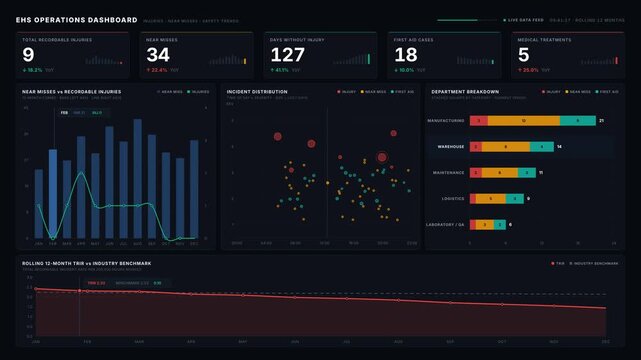
An engaging EHS operations dashboard showcasing injuries, near misses, and safety trends with animated metrics and charts in a dark mode interface for effective data visualization.
00:15
HD
Data Clusters Forming in Animated Scatter Plot Visualization
00:05
HD
Financial Risk Scatter Plot Wave Cascade Animation
00:06
HD
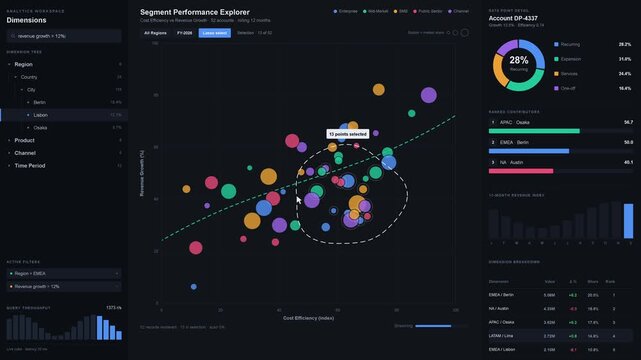
Explore a Business Intelligence Analytical Workspace showcasing a three-panel layout with a scatter plot, collapsible tree menu, and detailed data breakdown on a clean white background.
00:15
HD
Top view of engineer drink coffee and thinking about house plan at meeting table with equipment and safety helmet scatter around. Aerial view of stressful manager looking at blueprint. Alimentation.
00:17
HD
Green Scatter Plot Appear Animation Loop Background
00:10
HD
Scattered points collapsing onto a clean trend line, loop
00:10
HD
Premium 4K dark mode cluster capacity dashboard animation visualizing CPU memory requests limits and headroom with animated data charts and KPI counters on indigo background.
00:15
HD
Animated Scatter Plot Diagram With Teal Trend Line
00:08
HD
Visualize production risks with a dynamic dashboard showcasing machines threatening daily output targets through an animated scatter plot and color-coded health indicators.
00:15
HD
Scattered data point cluster rotating within a 3D wireframe grid space
00:10
HD
Data Correlation Analysis and Multivariable Scatter Plot Clusters
00:10
HD
Abstract Scatter Plot Point Cloud Clustering Into Colored Groups Data Visualization Seamless Loop in cool slate tones
00:10
HD
Correlation analysis scatter plot chart animation dark ui
00:10
HD
Scatter plot points converging to trend line animation
00:08
HD
Machine Learning Model Fitting A Curve To Scatter Data While Loss Chart Descends Seamless Loop
00:12
HD
Animated bar chart and scatter plot data visualization for business growth analysis and financial market trends animation 4k
00:10
HD
Clean animated scatter plot cloud finding in blue and cyan on a bright white background. Seamless looping 4K dashboard motion graphics with free space for text, ideal for business presentations, produ
00:07
HD
A smooth blue wave line representing a trend through scattered data points
00:10
HD
Multivariate scatter plot correlation and clustering engine analytical dashboard seamless loop animation
00:15
HD
A scatter plot visualization displaying data correlation on a dark background
00:10
HD
Digital data correlation scatter plot with glowing points
00:10
HD
Financial Risk Scatter Plot Progressive Reveal
00:06
HD
Dynamic Growth Curve Ascending Graph Animation Showing Data Progression Over Time In A Dark Blue Digital Background
00:20
HD
Architect engineer using laptop planning house design at office while sitting at meeting table with blueprint and equipment scatter around.Skilled civil engineer working at blueprint. Alimentation.
00:09
HD
Orang Scatter Plot Appear Animation Loop Background
00:10
HD
Farmland surrounding an industrial plant and solar installation. An aerial panorama shows a chimney, dark panel rows and crop plots beneath scattered clouds.
00:10
HD
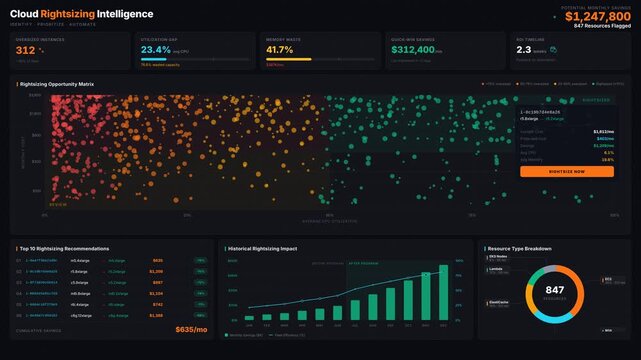
Premium 4K dark mode cloud rightsizing dashboard animation showing oversized resources, utilization gaps, and savings opportunities with dynamic charts and data.
00:15
HD
Tilted scatter plot with green data points trending up seamless loop
00:20
HD
A modern dark-mode repair operations dashboard showcasing technician response metrics and equipment recovery performance with colorful KPI cards and a scatter plot layout.
00:15
HD
A digital probability modeling process shows growing scatter plot clusters and increasing point density across three distinct interface windows against a deep dark purple background
00:06
HD
ecology plot markers scattered across sunlit valley, survey instruments and measured transects implied, biodiversity sampling scene for habitat assessment
00:06
HD
Abstract Scatter Plot Point Cloud Clustering Into Colored Groups Data Visualization Seamless Loop in rich graphite tones
00:10
HD
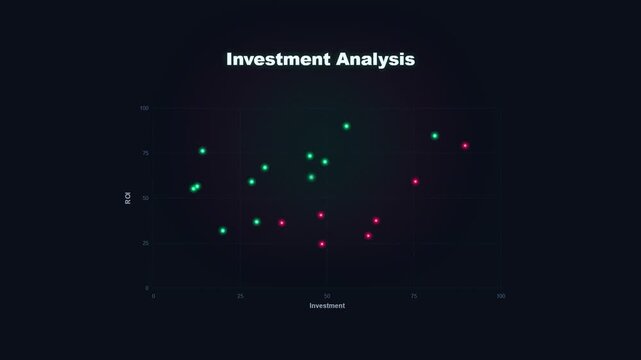
Investment analysis scatter plot chart animation dark ui
00:10
HD
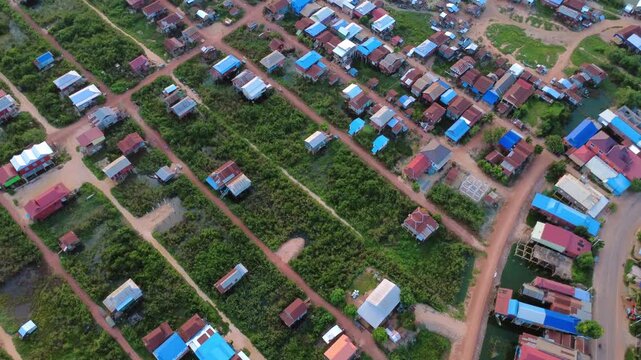
Aerial view of a floating village near Siem Reap, Cambodia, showing scattered homes, narrow waterways, dirt roads and green plots across a low-lying rural settlement.
00:17
HD
Machine Learning Model Fitting A Curve To Scatter Data While Loss Chart Descends Seamless Loop
00:12
HD
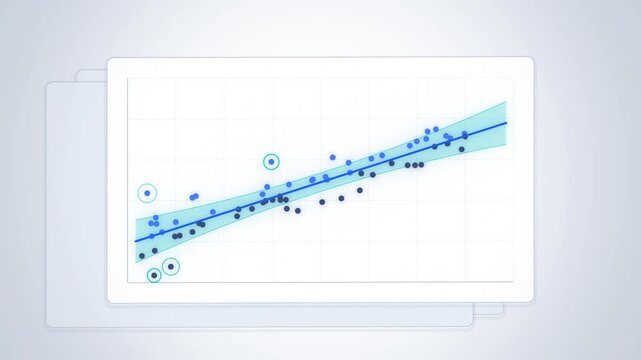
Regression line fitting a scatter plot with confidence band on white
00:20
HD
A dynamic video showcasing a scatter plot of multicolored data points on a white background, with camera zooming out to reveal intricate patterns. Data clusters and disperses, illustrating variability
00:10
HD
Minimalist scatter plot graph showing a downward data trend on black background
00:10
HD
Cluttered Office Desk Covered with Colorful Sticky Notes and Organizing Chaos
00:10
HD
Animated Business Dashboard – KPI Analytics Data Visualization Motion Graphics 4K Dark UI
00:15
HD
Animated growth bar chart with rising trend line and data points for financial success and business analytics presentations
00:16
HD
Financial Risk Scatter Plot Animation
00:06
HD