Um link para definição da senha foi enviado para Para acessar suas compras no futuro, você precisará de uma senha.
Obtenha 3 vídeos ou 25 imagens com um teste grátis
Novos filtros adicionados
Classificar por

19.767 resultados para increase and decrease em vídeos

Change of stock market with Exchange and bid, offer, volume on screen display
00:30
HD
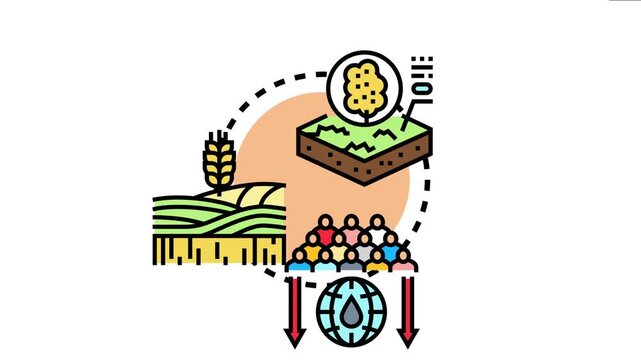
Global population consumption increasing while natural resources and agricultural output decreasing, depicting an urgent need for sustainable practices and environmental balance
00:17
HD
Business executives collaborating on environmental sustainability strategy utilizing renewable energy solutions to achieve net zero targets in corporate meeting.
00:12
HD
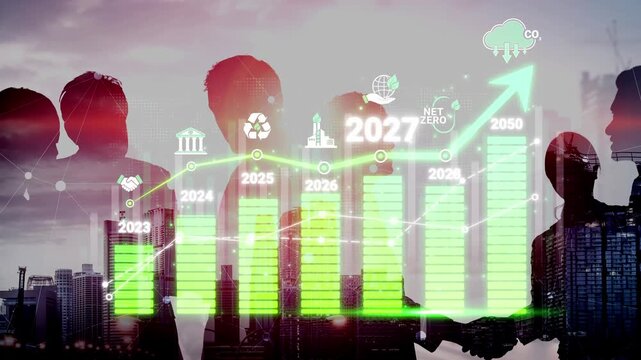
Business Growth and Sustainability Strategy with Graph and People Silhouette Representing Future Goals and Net Zero Commitment in Urban Environment Sigmoid
00:10
HD
Neon Celsius thermometer displayed temperature 28 degree. Digital Temperature Meter Display 28°C. That's indicates weather temperature 28 degree increase or decline.4k video.
00:10
HD
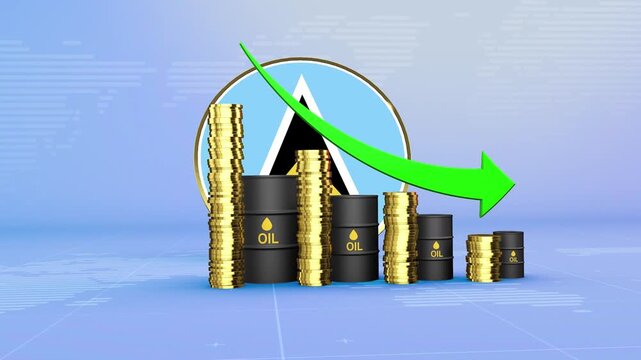
Saint Lucia Oil Prices Decline with Oil Barrels, Gold Coins and Downward Green Arrow, 3D Economic and Financial Market Concept
00:11
HD
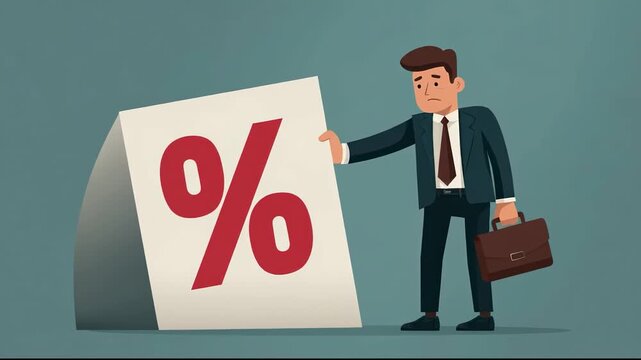
Businessman stopping increasing interest rate percentage sign
00:07
HD
money decrease and money growth animation
00:08
HD
Zoom in and out animation the bra symbol. Large black symbol in the center and four small symbols around. Seamless looped 4k animation on white background
00:12
HD
Business professional using laptop with holographic cost reduction graph and bars. Concept of financial efficiency, budget cutting, expense management, and corporate profit optimization.
00:10
HD
Trade Stock market business and exchange financial growth graph Chart arrow . Business chart data graph diagram, business trading graph investment growth global trend arrow up and down icon animation
00:12
HD
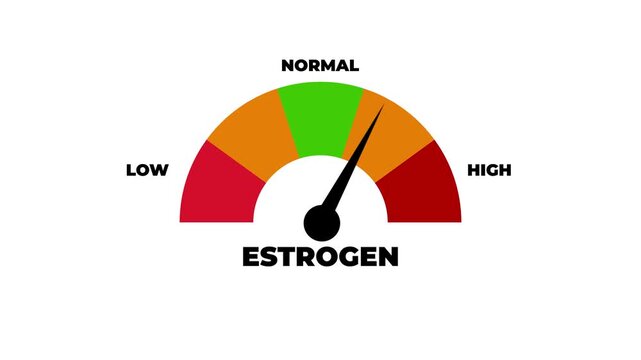
Animated estrogen level meter increasing from normal to high level for concepts related to high estrogen, hormone imbalance and women’s health.4k motion graphics video
00:10
HD
Digital landscape of financial data analysis
00:10
HD
Cost optimization concept, Decline in product service, quality and efficiency, Businessman touching virtual downward arrow, business video
00:05
HD
Neon Line Graph Arrow Downwards Against Black .Abstract neon line arrow down business graph.4k video.
00:13
HD
Innovative Finance Solution for Climate Action Promoting Sustainability through Renewable Energy Technology and Wind Power Strategy
00:05
HD
World Map with Financial Graphs and Red Arrows Indicating Downward Trend Suggesting Global Economic Decline and Financial Data Analysis with Bar Charts and Percentage Figures Highlighting Global
00:10
HD
Dollar currency value decrease on financial graph. Red line showing falling market trend. Business finance data footage.
00:05
HD
Wooden pie chart segments changing, increasing and decreasing in height, illustrating growth and decay, placed on a wooden surface with visible shadows
00:08
HD
Cyan Neon Arrows Moving Right in Graduated Sizes on Dark Background glowing 4k video .
00:10
HD

A grand stock market chart background with blue and red glowing candlestick graph lines for a financial business concept,
00:10
HD
Product sales volume analyzing process, monitoring market success and tracking failures, evaluating business strategy to increase revenue and sales performance
00:17
HD
Business executives collaborating on environmental sustainability strategy utilizing renewable energy solutions to achieve net zero targets in corporate meeting.
00:13
HD
Futuristic Concept of Artificial Intelligence Integration with Cost and Quality Metrics Represented by Robotic Hand and Human Hand Gesture Sigmoid
00:10
HD
Neon Celsius thermometer displayed temperature 48 degree. Digital Temperature Meter Display 48°C. That's indicates weather temperature 48 degree increase or decline.4k video.
00:10
HD
Eco friendly power plant and tree a symbol of sustainable energy and low carbon emissions
00:05
HD
Business finance growth and progress animated green bar graph with statistics presentation. Data visualization presentation template with green bar graph for marketing and finance.
00:11
HD
Neon glowing medical thermometer icon animation. That's indicates weather temperature 41 degree increase or decline. Thermometer equipment showing hot or cold weather.
00:10
HD
Abstract Area Chart with Data Points Representing Business Growth and Financial Trends.
00:11
HD
Percentage Symbol with Rising Arrow Icon Animation – Dynamic 4K Stock Video
00:07
HD
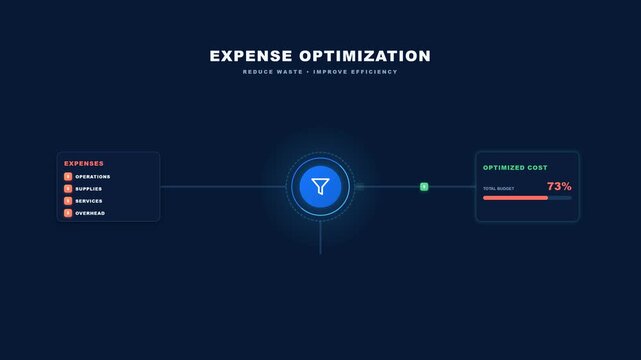
Expense Optimization abstract concept with filter and progress bar.
00:08
HD
marching across the mountains while camping,
00:05
HD
Trade Stock market business and exchange financial growth graph Chart arrow . Business chart data graph diagram, business trading graph investment growth global trend arrow up and down icon animation
00:12
HD
Business Loss Graph .Loss concept business graph with white background
00:07
HD
Animated arrow growth down graph icon on background Market Recovery Concept. ,Bar graph fall down with arrow. Animated down graph icon design in flat icon style.
00:10
HD
Arrow continuous line 4K animation video showing downward direction on a minimal background
00:10
HD
Financial data visualization with declining numbers in a clean studio setting. Suitable for corporate reports and economic analysis.
00:52
HD
Circular economy concept for future business growth and environmental sustainability and reduce pollution for future business and environmental growth.Wooden cubes .4k corporate video.Place for logo
00:13
HD
Three word kinetic typography sequence displaying Unmissable Event Today with sequential letter spacing reduction and sharp zoom transition
00:12
HD
The birth of a new life, green shoots are making their way out of the ground
00:09
HD
Business graph and bar chart, Business Financial Growing Business Income and Earnings. business growth target graph bar animation on a cyan background.
00:08
HD
Investment portfolio diversification concept showing various assets, financial instruments, and strategic management for risk reduction and optimizing returns
00:17
HD
Business executives collaborating on environmental sustainability strategy utilizing renewable energy solutions to achieve net zero targets in corporate meeting.
00:12
HD
A robotic hand points towards a digital representation of a cost percentage and a data graph, illustrating the intersection of technology and financial analysis in a corporate environment. Synapse
00:13
HD
Neon Celsius thermometer displayed temperature 09 degree. Digital Temperature Meter Display 09°C. That's indicates weather temperature 09 degree increase or decline.4k video.
00:10
HD
Red colorful downward trend arrow graph on black background symbolizing representing financial and market loss, market decline, business decrease, economic crisis, and negative growth concept.
00:06
HD
Horizontal Row of Blue Chevron Arrows Pointing Leftward on Black Background direction
00:10
HD
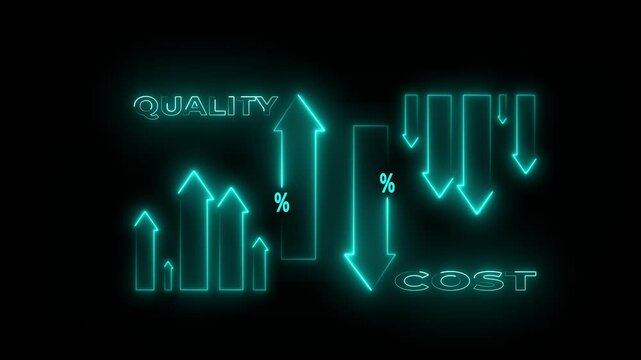
Quality increase and cost optimization for products or services to improve efficiency. Effective business, Efficient Risk, Cost report .
00:12
HD
Bar Chart Data Visualization with Rising Trends and Declining Segments.
00:11
HD
Ultraviolet Level Text or Word Low and Medium to High Meter Concept Animation on Black Background and Blue Screen
00:58
HD
Quality cost percentage business growth and finance technology with digital data analysis concept showing improvement efficiency and financial growth using glowing blue icons and arrows for modern
00:08
HD
Abstract finance chart with dollar coin icons gradient background animation
00:10
HD
Dynamic financial data visualization with green bars and lines
00:14
HD
Teal candlestick bars sliding in, trend line tracing, gauges filling, visualizing market data
00:15
HD
Financial Business Chart with Stock Market Down Arrow and Economic Crisis Animation video.
00:08
HD
Arrow continuous line 4K animation video showing downward direction on a minimal background
00:10
HD
Financial Decline Concept with Dollar Sign Magnifying Falling Bar Graph on Green Background
00:15
HD
Digital transformation in business concept. Leveraging modern technologies; automation, data analytics, cloud computing and AI to increase efficiency, reduce costs and gain competitive advantage.4k
00:10
HD
phrase Lead Your Sector in Spanish, animated word by word with spacing reduction and sharp zoom transitions, available in four background and outline versions.
00:12
HD
Rapid change of stock market with Exchange and bid, offer, volume on screen display
00:12
HD
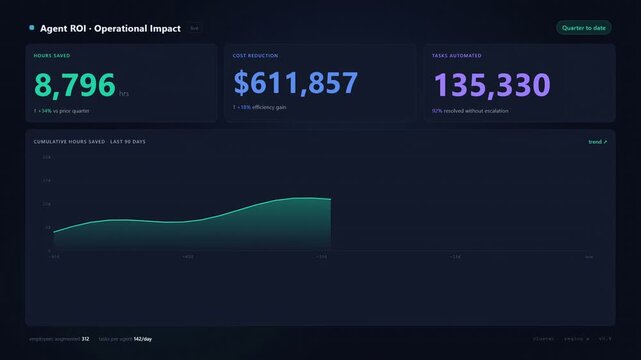
Animated Agent ROI & Operational Impact Dashboard UI. Dark mode interface showing hours saved, cost reduction, tasks automated counters, and cumulative growth charts.
00:15
HD
Candle stick bar growth chart move up and down animation simple, bar chart Glyph Icon Background black,
00:10
HD
Glowing red bar chart and downward arrow illustrating business decline, financial loss and economic downturn. Concept of recession, falling profits, market crash and negative growth performance
00:12
HD
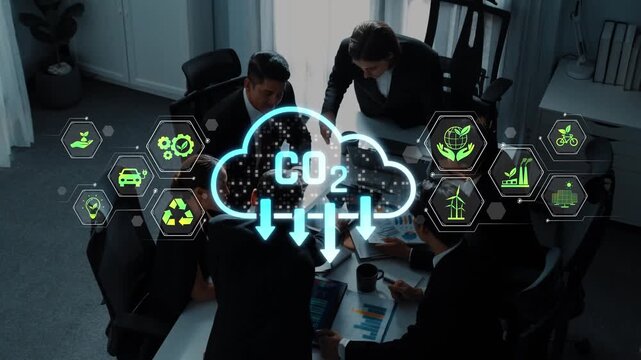
A group of professionals engages in a business meeting focused on sustainability strategies, showcased with digital graphics representing CO2 emissions and eco-friendly icons. Raster
00:20
HD
Neon Celsius thermometer displayed temperature 59 degree. Digital Temperature Meter Display 59°C. That's indicates weather temperature 59 degree increase or decline.4k video.
00:10
HD
Cost reduce and high quality control concept. Businessman holding cost with down arrow and quality with up arrow for business with keywords isolated on white board background.
00:10
HD
Decreasing trend red glowing line graph on black background. Recession chart of economy. Economic crisis, recession, decrease graph.
00:10
HD
Financial Report Presentation Animation with Business Growth Visualization
00:10
HD
Falling bar chart with a downward line and rising arrows animation, Business chart with rising arrows decline
00:09
HD
Abstract decrease icon on black background. Dollar rate up to down looped icon. Reduce costs sign.Money increases icon, dollar arrow up icon .Glowing up arrow with dollar sign. Glowing neon line.4k
00:10
HD
Curved red arrows pointing downward.
00:09
HD
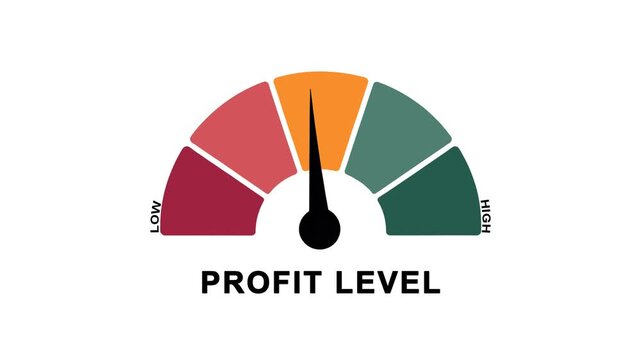
Animated profit level meter showing movement from high level to low level, ideal for illustrating declining revenue, financial loss, and reduced business performance
00:10
HD
Business executives collaborating on environmental sustainability strategy utilizing renewable energy solutions to achieve net zero targets in corporate meeting.
00:12
HD
Red neon arrow showing downward or decreasing market trend on black grid background. Futuristic glowing line graph indicating decline, negative growth, or decreasing analytics statistics concept.
00:06
HD
A dynamic financial chart displays decreasing percentages with a glowing red line on a dark background
00:07
HD
Arrow continuous line 4K animation video showing downward direction on a minimal background
00:10
HD
Yellow Bar Chart Illustrating a Decreasing Trend on a Grid Background graph data. Abstract digital graph with neon yellow bars decreasing across grid forming dynamic data visualization.
00:09
HD
Animated bar chart with falling trend line and downward arrow on clean background, representing financial loss, market decline, negative growth, and business downturn.
00:10
HD
Three word kinetic typography sequence displaying Scale Your Campaigns with sequential letter spacing reduction and sharp zoom transition
00:12
HD
Data corridor overlay appearing and monitoring eco power gauge filling then dropping beside racks
00:10
HD
Daily, marketing graph showing marketing sales profit increasing and decreasing  to future target business concept.
00:15
HD
budget planning icon and Business structure of network, financial forecasting tools, expense optimization strategies, cost reduction methods, investment management solutions
00:11
HD
Zoom in and out animation the zodiac ophiuchus symbol. Large black symbol in the center and four small symbols around. Seamless looped 4k animation on white background
00:12
HD
Business professional holding smartphone with artificial intelligence charts depicting cost reduction and quality improvement in a digital cityscape background Gluon.
00:10
HD
Neon Celsius thermometer displayed temperature 20 degree. Digital Temperature Meter Display 20°C. That's indicates weather temperature 20 degree increase or decline.4k video.
00:10
HD
Dollar sign with an upward arrow,Money crisis icon,Financial crisis icon,Dollar rate decrease . Money symbol with down arrow, falling arrow infographic glyph icon. 4k ..
00:10
HD
A prominent dollar sign symbol representing currency exchange rates is overlaid on a detailed financial chart illustrating stock market trends global economic growth and investment analysis.
00:05
HD
Business grow-ting arrow. Rising bar follow the arrow. Abstract neon arrow growth , success concept. Profit growing icon animation.
00:10
HD
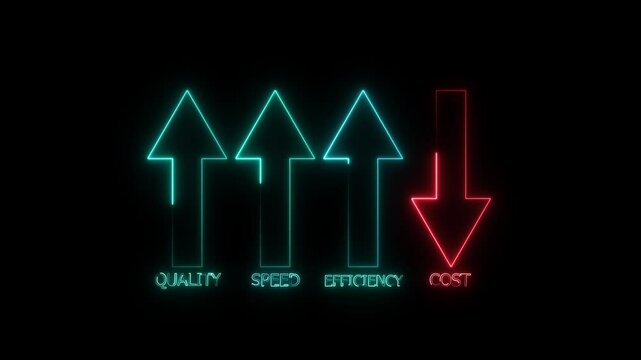
Hand drawing business diagram concept about increasing efficiency, quality and speed but decreasing cost arrow. Performance concept of increase quality, speed, efficiency and reduce cost.
00:10
HD
Smooth line Simple Finance business growth graph chart with arrows moving down, falling, loss, diagram, motion graphic on a red classic abstract Grid background
00:08
HD
Neon line business graph icon featuring a glowing chart with a downward arrow, symbolizing decline, loss, market drop, risk, or negative growth.
00:10
HD
Dental filling, tooth restoration, cavity repair. Oral health. Fillings prevent tooth decay. Amalgam ensures lasting durability. Pain reduction enhances daily comfort.
00:10
HD
Business executives collaborating on environmental sustainability strategy utilizing renewable energy solutions to achieve net zero targets in corporate meeting.
00:14
HD
This abstract image portrays carbon molecules turning into green leaves, symbolizing the essential conversion of CO2 to oxygen by photosynthesis. Carbon reduction
00:06
HD
A vibrant display of green LED lights forming the word 'SALE' in a financial setting, highlighting significant price reductions and enticing customers within the trading environment.
00:05
HD
Volume Level Text or Word Low and Medium to High Meter Concept Animation on Black Background and Blue Screen
00:58
HD
Global Stock Market Crash Visualization: Animated World Globe with Real-Time Stock Data, Economic Downturn Analysis
00:08
HD
Abstract digital graph with cyan bars, glowing data point, and grid layout for black interface design. Cyan Bar Chart with Glowing Dot and Grid on Black Background graph data.
00:11
HD
Three-word text animation featuring Focus On Growth with sequential word reveal, spacing reduction effect, and zoom transition in 3840x2160 format.
00:12
HD
Rising arrow transparent channel. arrow rising transparent channel, business growth arrow and graph chart, Business line arrow.
00:10
HD