Um link para definição da senha foi enviado para Para acessar suas compras no futuro, você precisará de uma senha.
Obtenha 3 vídeos ou 25 imagens com um teste grátis
Novos filtros adicionados
Classificar por

12.754 resultados para decrease arrow em vídeos

Falling black and white arrows motion graphic on green screen background.
00:12
HD
Cost reduction concept. Cost wording on decrease money with down arrow. Cost Management, Economy recession, low budget,4k
00:10
HD
business graph chart and success arrow indicating profit profit and loss business plan motion graphics.
00:10
HD
Minimalist four direction arrows symbol dynamic motion loop u i branding visuals corporate
00:10
HD
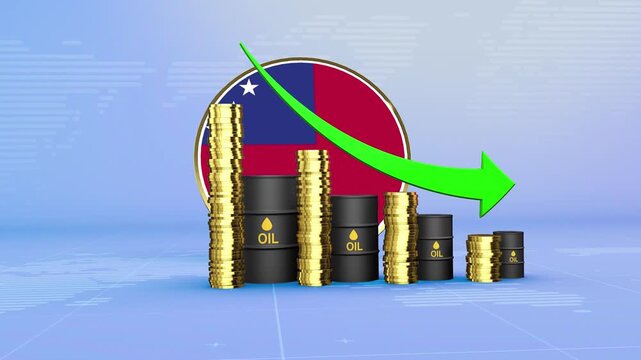
Samoa Oil Prices Decline with Oil Barrels, Gold Coins and Downward Green Arrow, 3D Economic and Financial Market Concept
00:11
HD
Business graph chart arrow line down white color animation on black background. growth concept white moving.
00:15
HD
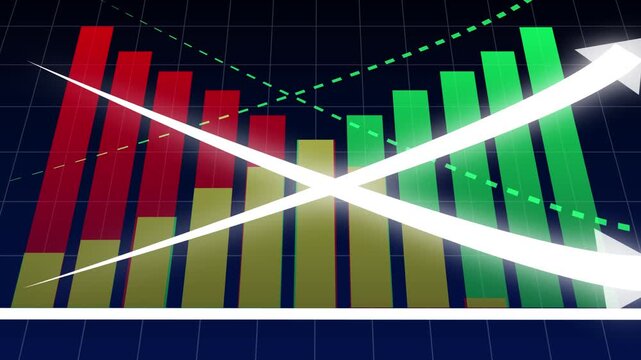
Financial Market Comparison Showing a Shift from Declining Red Performance to Rising Green Growth with Crossing Arrows, Recovery Trends, and Business Transformation
00:10
HD
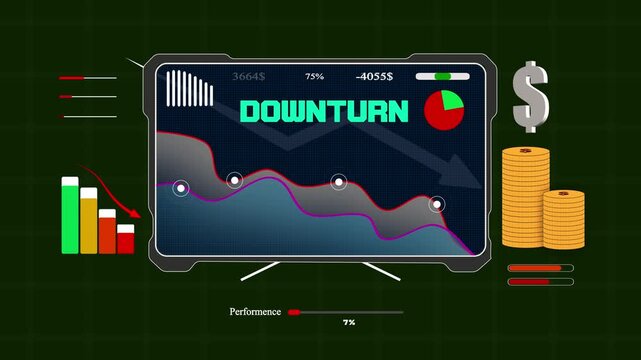
Modern electronic screen displaying economic downturn statistics to help investors visualize decreased profit in trading markets
00:15
HD
Declining financial bar chart with downward arrow animation
00:09
HD
Dollar Neon Animation,  Red neon dollar sign with downward arrow animation for financial loss and market decline currency money
00:12
HD
arrow icon animation,downward arrow curve line animation on black background.
00:10
HD
Financial Crisis Stock Market Decreasing Bearish Trend Chart
00:10
HD
Financial Growth Trend Animation with Positive Revenue Indicators
00:09
HD
Neon blue dollar coin with downward arrow animation for financial market decline and economic loss concepts
00:10
HD
Business concept risk mitigation through financial planning, loss prevention, and managing negative impacts on customers or market conditions
00:17
HD
Global Recession Economic Downturn Financial Crisis World Map Chart Graph Decline Arrow Red Blue. Global Economic Downturn And Recession With Financial Crisis, Decline, And Market Plunge
00:08
HD
Interest rate graphic with glowing blue downward trending line and percentage symbols on black background
00:07
HD
Declining bar chart visualizes negative corporate revenue trends. Modern bar chart displays falling stock market investment values. Financial crisis concept with bar chart.
00:08
HD
graph chart up down business statistics report
00:10
HD
Green Neon Arrow Down Symbol on Easel Display.
00:08
HD
White price card shows an old dollar price crossed out in red, then a lower new price slams in with a down arrow and minus 50 percent badge on green screen
00:10
HD
Djibouti Oil Price Falling with Oil Barrels Downward Green Arrow and 3D Financial Data Visualization Graphs for Economy and Business Concept
00:11
HD
Close-up stock market trading screen with market data, trading volume, prices and percentage changes. Investment strategy, analyzing, data spreadsheet, financial figures, trading board, exchange infor
00:10
HD
Financial Loss Chart Line Icon. Animated line art graph showing downward trend and dollar coin for bankruptcy price drop and market loss animation. business loss concept animation
00:12
HD
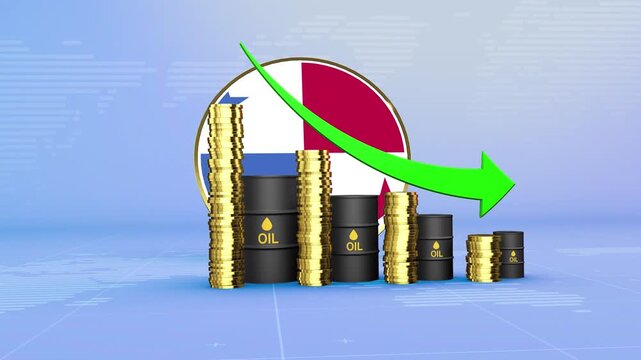
Panama Oil Prices Decline with Oil Barrels, Gold Coins and Downward Green Arrow, 3D Economic and Financial Market Concept
00:11
HD
Neon line Down business graph loss project. 4k Business graph. loss graph direction. damage business graph. down business graph icon. business or finance concept icon animation.
00:10
HD
Declining Financial Market Performance Illustrated by Red Falling Bar Chart, Downward Arrow, and Negative Business Growth Trend
00:10
HD
Revenue decline chart animation drops on dark grids. Corporate revenue decline chart animation tracks market recession. Modern revenue decline chart animation details losses.
00:10
HD
glowing neon downward graph with arrow  indicating decline, loss, and negative trends on a dark, abstract background, perfect for conveying risk, crisis animation. 4k
00:10
HD
Icon representing body contouring and fat reduction with arrows indicating change
00:06
HD
Neon style rotating bar graph animation on black background representing data analysis and market trends
00:08
HD
recovery rate level indicator scale. Low normal high meter infographic animation on black background. Showing high pressure level color gauge indicator.4k quality animation video
00:10
HD
Finance money dollar sign with downward arrow symbolizing loss or decrease in currency value on black background.
00:10
HD
Revenue and Profit Growth Animation for Corporate Business Reports
00:08
HD
Business growth graph showing exponential progress and profit growth. Growth of statistical bars and columns, upward arrow. Finance, upward bar graph, profit concept, positive growth chart animation.
00:10
HD
Recycling Symbol: A 3D rendering of the universal recycling symbol, depicted in a vibrant green hue, conveys the importance of sustainability and environmental consciousness.
00:08
HD
Red and green arrows that represent player substitutions in football (soccer) on a transparent background (Alpha channel). Stock market price change concept.
00:06
HD
Business graph. loss graph direction. damage business graph. white colour down business graph icon. business or finance concept icon animation.
00:10
HD
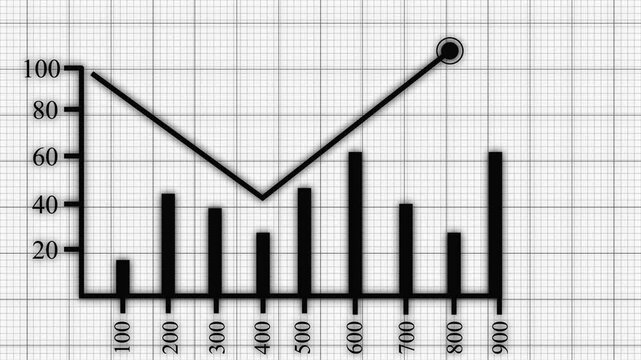
graph chart up down business statistics
00:06
HD
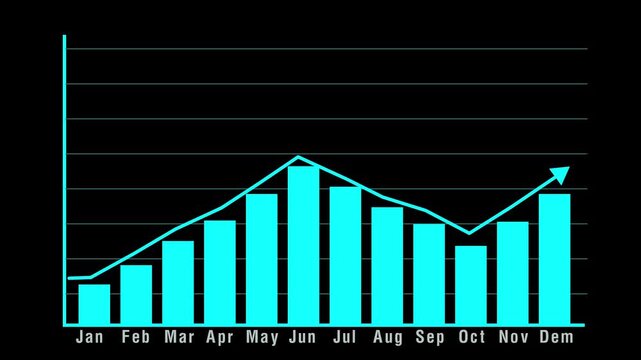
Cyan bar chart animation displays fluctuating market trend lines. Trading volatility analytics track on this cyan bar chart. Corporate economic investment revenue drives the bar chart.
00:10
HD
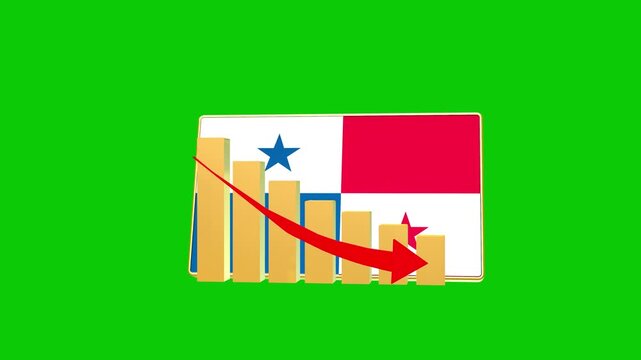
Panama economic bar chart graph showing decreasing downturn with national Flag 3D animation on black background.
00:16
HD
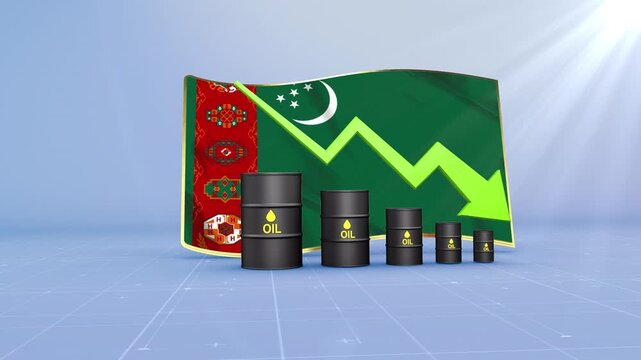
Turkmenistan Oil Price Falling with Oil Barrels Downward Green Arrow and 3D Financial Data Visualization Graphs for Economy and Business Concept
00:11
HD
Decreasing bar chart with downward arrow on green background a with bars in height
00:15
HD
Download free with trialBusiness efficiency concept on black background. how much a company or organization can produce as it relates to time, cost and quality.
00:15
HD
Nigeria Oil Prices Decline with Oil Barrels, Gold Coins and Downward Green Arrow, 3D Economic and Financial Market Concept
00:11
HD
decrease icon animation video. dollar rate decrease today.
00:05
HD
Glowing green neon bar chart with downward arrow line on black background, futuristic business loss decline graph diagram indicator, stock market crash UI UX motion graphic video effect.
00:10
HD
Cost Reduction and Expense Decrease Animated Icon, Business Finance Concept
00:10
HD
Business graph chart with growing business concept. Abstract decreasing business graph chart animation  background.
00:10
HD
Green and red arrows illustrating up and down trends. Ideal for financial concepts, market analysis presentations, investment reports, and business infographics.
00:06
HD
Population reducing global fossil fuel consumption, impacting barrels of resource and financial markets, decreasing need and environmental responsibility
00:17
HD
Decline in value of securities. Loss of equity stock assets. Business loss falling down with dollar icon.HD, video, black, background,
00:10
HD
Two ladder icons with directional arrows showing ascending and descending paths representing progression or skill level system
00:10
HD
Revenue and Profit Growth Animation for Corporate Business Reports
00:08
HD
Responsibility level indicator scale. Low normal & high meter infographic animation on black background. Showing high responsibility level color gauge indicator for accountability and performance.
00:10
HD
Red Slider Moving Down a Vertical Scale
00:08
HD
A 3D wireframe digital dollar sign rotating against a dark red grid background, surrounded by white arrows falling downward to represent financial drop, inflation, or market loss.
00:10
HD
Thick white hand-drawn straight diagonal chalk arrow pointing to the bottom right with shaky rough line and open V head, boiling jitter and repeating push loop animation on green screen background
00:10
HD
graph chart up down business statistics report
00:06
HD
Bar graph animation with red declining bars. Bar graph financial loss on digital grid. Bar graph business failure graphic on black background for data.
00:09
HD
Afghanistan economic bar chart graph showing decreasing downturn with national Flag 3D animation on black background.
00:16
HD
Red Downward Arrow with Price Down Text on Bright Green Background for Sale and Discount Promotion 4K
00:06
HD
Neon Dollar Sign with Downward Arrows in a Circle
00:10
HD
Green pixel art down arrow icon on black background
00:08
HD
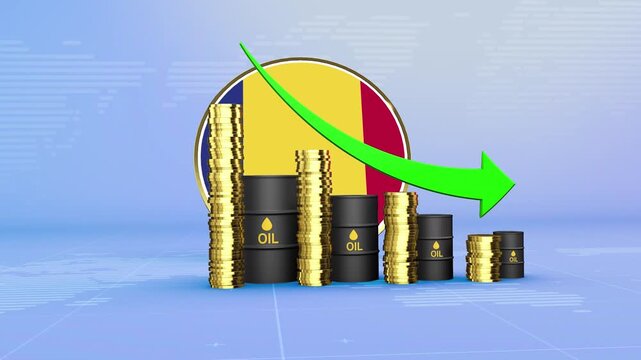
Romania Oil Prices Decline with Oil Barrels, Gold Coins and Downward Green Arrow, 3D Economic and Financial Market Concept
00:11
HD
Grocery with falling red arrow chart chart and shopping cart, decreased purchasing power due to high prices of basic necessities.
00:15
HD
Downward zigzag arrow on green background a black pointing on a solid black direction decline
00:10
HD
Money reduction icon animation on black background. Dollar currency price drop concept. circle with down arrow moving animation. 4k video
00:10
HD
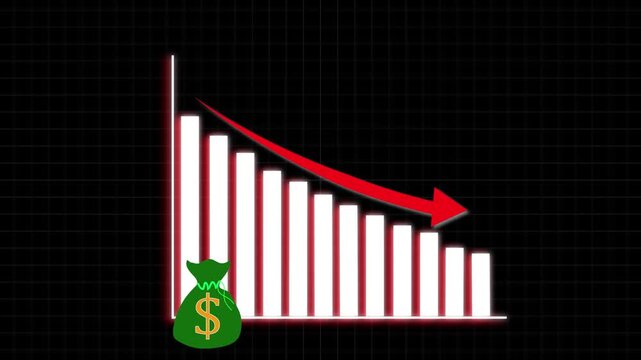
White Bar Chart with Red Arrow and Money Bag Indicating Financial Decline on Dark Grid
00:12
HD
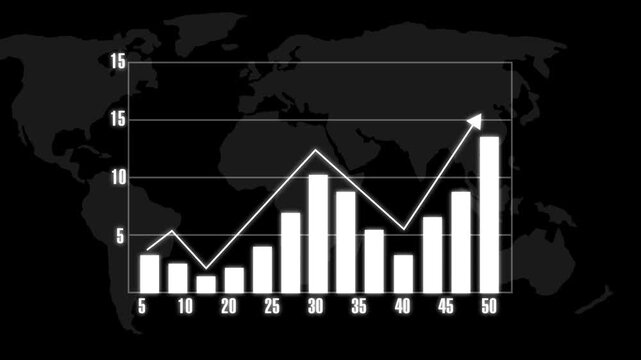
Global growth graph business chart animation tracks world maps. Growth graph digital interface highlights corporate marketing data. Business chart layout looks professional.
00:06
HD
White Curved Arrow Pointing Down Animation Black Background
00:10
HD
Financial Market Decline: Dollar and Euro Currency Exchange Animation with Downward Trend
00:10
HD
Asian man hand turns car AC off to on, increases fan speed, decreases temperature, then increases temperature for driving comfort in tropical weather
00:23
HD
Financial Growth Trend Animation with Positive Revenue Indicators
00:09
HD
glowing neon Quality control and company cost reduction. Cost reduction icon animation. Cost decrease money down arrow. corporate business efficiently save cost and company resources by reduction.
00:12
HD
Israel Oil Price Falling with Oil Barrels Downward Green Arrow and 3D Financial Data Visualization Graphs for Economy and Business Concept
00:11
HD
Dynamic bar graph animation with recursive red arrows, representing growth, analysis cycles, and feedback loops, for business data visualization and financial reporting.
00:05
HD
Business graph chart arrow line down red color animation on white background. growth concept red moving.
00:13
HD
Red Neon Dollar Sign with Downward Arrow Symbolizing Financial Loss or Cost Reduction, loss in business market concept video  animation, dollar and down arrow  animation on black background.
00:10
HD
Two curved arrows pointing in opposite directions minimal animation
00:06
HD
Animated digital cyan bar chart showing a decreasing trend in business performance for financial loss and analysis visuals. Bar chart animation with decreasing trend perfect for financial downturn. 4k
00:10
HD
Glowing neon Quality control and company cost reduction. Cost reduction icon animation. Cost decrease money down arrow. corporate business efficiently save cost 4k animation video.
00:10
HD
Bar chart rendered in cool blue neon lines emphasizes a continuous drop in values with a clear downward arrow representing poor quarterly results or declining productivity within modern corporate.
00:10
HD
Rising and Falling Direction Arrows Market Trend Increase Decrease Concept on white Background,
00:10
HD
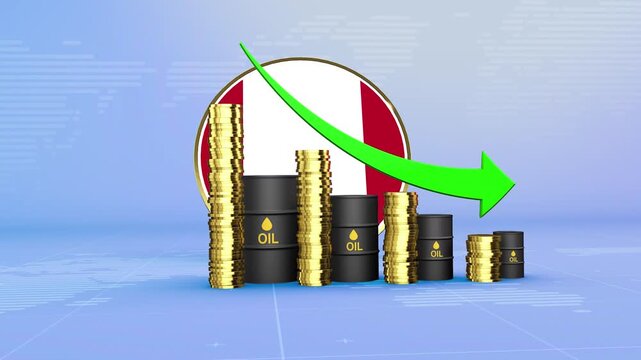
Peru Oil Prices Decline with Oil Barrels, Gold Coins and Downward Green Arrow, 3D Economic and Financial Market Concept
00:11
HD
A red line graph trending downward against a black background with a white section at the bottom.
00:10
HD
Declining financial graph with euro symbol on green background
00:15
HD
Blue Neon Dollar Sign with Downward Arrows in Circle
00:10
HD
A businesswoman holding a smartphone points forward at a graphic animation featuring rising arrows surrounded by percentage symbols. Ideal for charts, reports, or financial visual representations.
00:08
HD
Decreasing bar chart neon sign declining trend graph red glowing bars arrow falling sales statistics economic downturn
00:10
HD
Global growth graph business chart animation tracks world maps. Growth graph digital interface highlights corporate marketing data. Business chart layout looks professional.
00:06
HD
2027 New year with percentage change to UP and Down arrow with coin stack. Interest rate, GDP, stocks market, financial, deflation and Inflation, mortgage, debt, Loan and Economic Recession

00:10
HD
Cost Reduction and Expense Decrease Animated Icon, Business Finance Concept
00:10
HD
Revenue and Profit Growth Animation for Corporate Business Reports
00:08
HD
Glowing Red Stock Market Line Chart with Falling Arrows Overlay Animation on Black
00:10
HD
Philippines Oil Price Falling with Oil Barrels Downward Green Arrow and 3D Financial Data Visualization Graphs for Economy and Business Concept
00:11
HD
Minimalist black lines converging into a downward arrow on white background for corporate presentation
00:05
HD
Carbon Dioxide Reduction: Hand Holding Glowing Sphere with CO2 Cloud and Arrows, Sustainable Energy, Recycling, and Environmental Protection Concepts
00:08
HD
Triglycerides level indicator scale. Low normal & high meter infographic animation on black background. Showing high triglycerides level color gauge indicator for blood health and cardiovascular.
00:10
HD
Abstract background with thin arrows pointing downward,showing decline fall and movement animation
00:20
HD