Um link para definição da senha foi enviado para Para acessar suas compras no futuro, você precisará de uma senha.
Obtenha 3 vídeos ou 25 imagens com um teste grátis
Novos filtros adicionados
Classificar por

37.804 resultados para control chart em vídeos

A powerful dark tech interface with neon blue accents and icons symbolizing business integrity, ethical standards, and a transparent corporate network.
00:10
HD
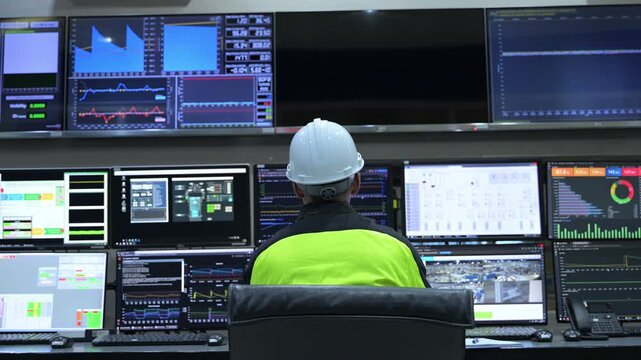
Professional engineer monitoring complex data systems on multiple screens in modern control center. Male worker analyzing digital charts and graphs for security and automation performance.
00:13
HD
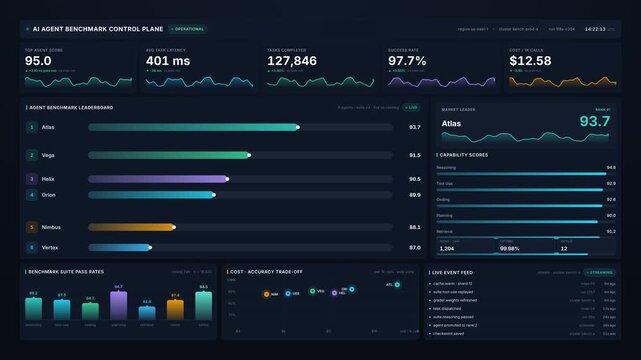
Ai agent benchmark control plane interface for model performance metrics, for artificial intelligence evaluation, automated systems tracking, data analysis, software development
00:20
HD
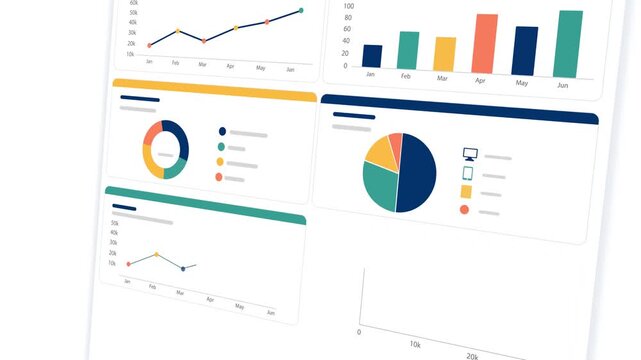
Modern Business Analytics Dashboard Animation with Multiple Data Visualization Panels like Charts, Graphs,  KPI Widgets, And Financial Statistics In A Clean Flat Design. Professional Website Metrics
00:49
HD
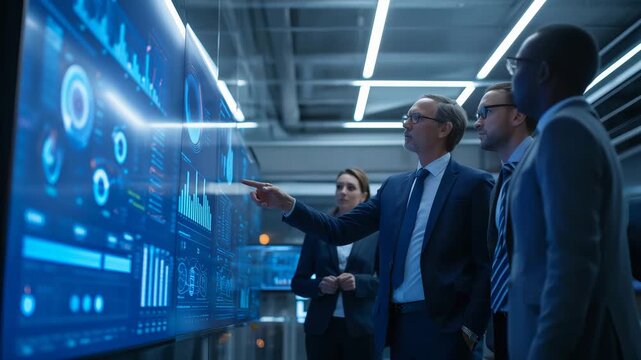
Diverse business professionals analyzing complex data on large futuristic digital display screens in a modern control room environment showcasing financial charts and graphs with glowing blue
00:10
HD
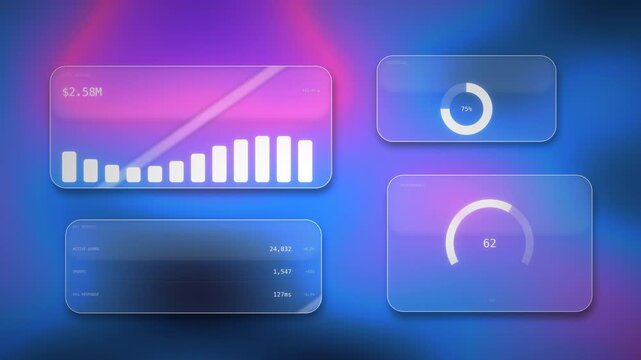
Aurora signature liquid glass frosted dashboard with bar chart donut gauge and KPI metrics widgets over aurora gradient, premium visionOS spatial UI background, seamless loop animation
00:10
HD
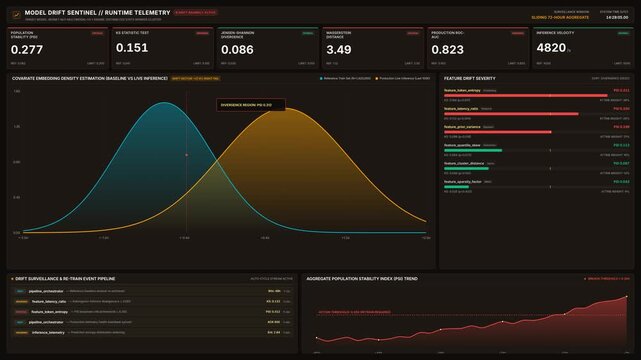
Model drift sentinel runtime telemetry dashboard tracking metrics, for system monitoring, data analysis, performance evaluation, artificial intelligence quality control software
00:20
HD
Glowing neon Success stairs sign with flag icon animation  Neon glowing Person Climbing Stairs Towards Success flag, Glowing neon business graph chart concept. on black background ,4k video
00:10
HD
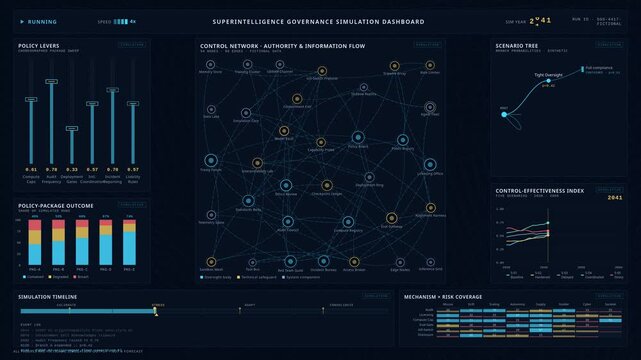
A dynamic simulation dashboard visualizing future AI governance scenarios with control networks, policy levers, and animated data charts against a midnight blue background.
00:15
HD
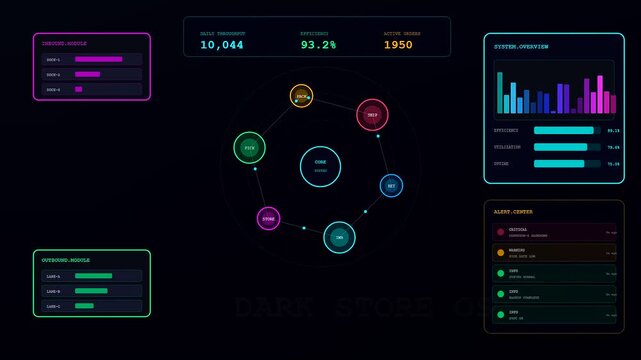
This futuristic digital user interface demonstrates Dark Store Automation with colorful interactive data charts performance statistics and system nodes on a dark background
00:06
HD
Futuristic sci-fi holographic user interface control panels with data analytics charts and graphs on a dark background
00:06
HD
Flat vector illustration of a robot assistant beside a cloud protection dashboard with database, shield, folder, and key icons, representing secure cloud management, access control, and automation.
00:10
HD
Digital Security Concept with Data Protection, Privacy Features, and Business Analysis Tools for Safe Online Transactions and Secure Collaboration Gluon.
00:12
HD
Vertical video: Mechanic grabbing grinder, working on bumper, HUD charts guiding repair
00:12
HD
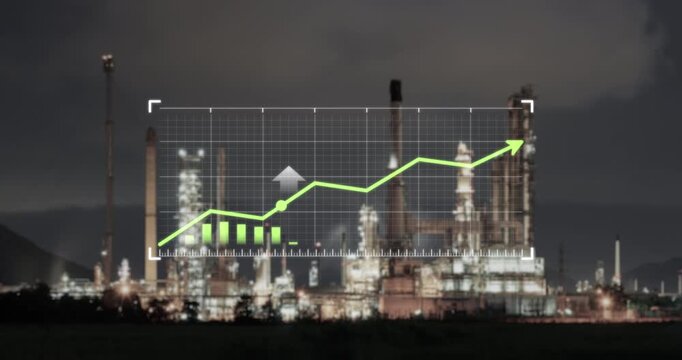
Industrial business concept with rising financial graph overlaying oil refinery plant at night. Symbolize increasing oil prices, refinery operating costs and growth in global power and energy sector.
00:18
HD
Futuristic digital control panel with moving charts and glowing data graphs
00:10
HD
Close view of eyes and market chart reflection. Attention to price action, market focus and risk control
00:15
HD
Animated stock trading platform interface with candlestick chart order book and buy sell controls
00:12
HD
A detailed overview of a dark-mode Industry 4.0 command center dashboard featuring real-time OEE metrics, production line status, and KPI cards in a corporate environment.
00:15
HD
A digital reasoning loop shows probability distribution curves moving across three sequential screens within a dark interface featuring glowing cyan pink and green line charts
00:06
HD
Business team analyzing digital data in futuristic control room, technology innovation and analytics concept
00:05
HD
Professional engineer monitoring complex data systems on multiple screens in modern control center. Male worker analyzing digital charts and graphs for security and automation performance.
00:12
HD
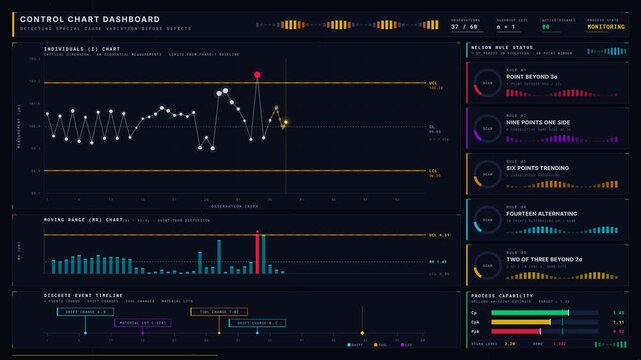
A sophisticated control chart dashboard visualizes special cause variation before defects, featuring luminous data points and dynamic violation alerts on a dark canvas.
00:15
HD
Close-up of a magnifying glass focusing on an AIOPS interface above a laptop, symbolizing AI-driven IT operations, monitoring, automation, cloud infrastructure, and performance analysis.
00:15
HD
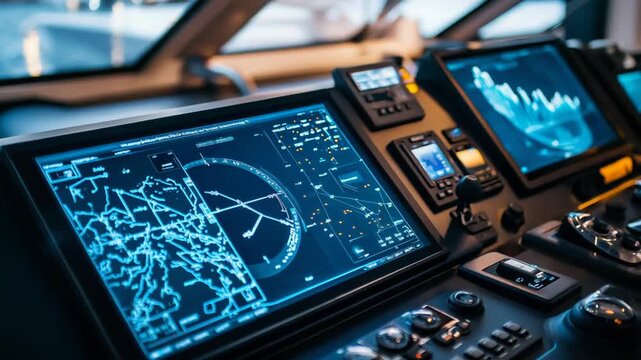
Ship bridge with multiple digital screens and control panels for advanced marine navigation, radar, electronic charting and autopilot systems guiding vessels across open sea
00:05
HD
Green Screen Pie Chart Progress 70 Percent Loading Animation UI Element
00:08
HD
Comprehensive Flight Control Dashboard with Full Air Traffic Data, Navigation Systems, and Real-Time Information Displays
00:06
HD
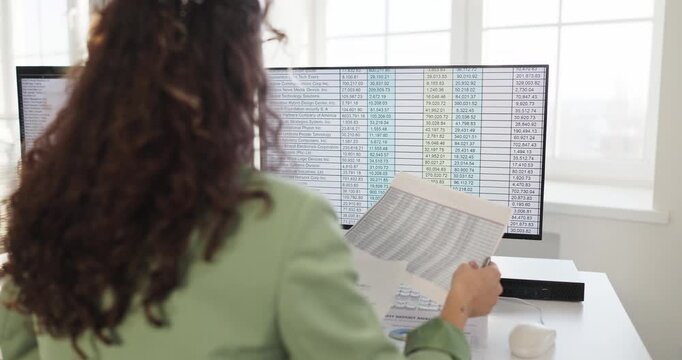
Woman analyst in office reviewing finance data spreadsheet. An accountant reads a computer screen and a printed report, checking records for accuracy. Financial review and control concept.
00:10
HD
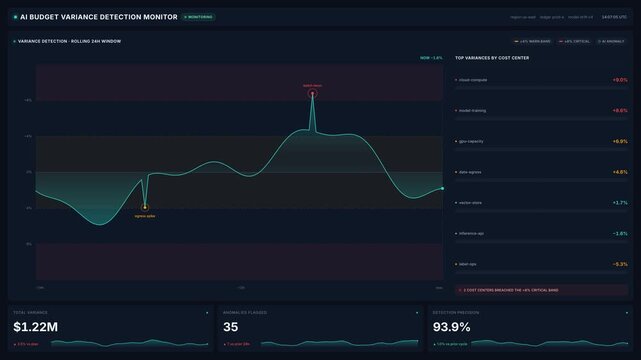
Ai budget variance detection monitor dashboard with 24 hour line chart cost center percentages, for 4k financial analytics, cloud spend tracking budget control
00:20
HD
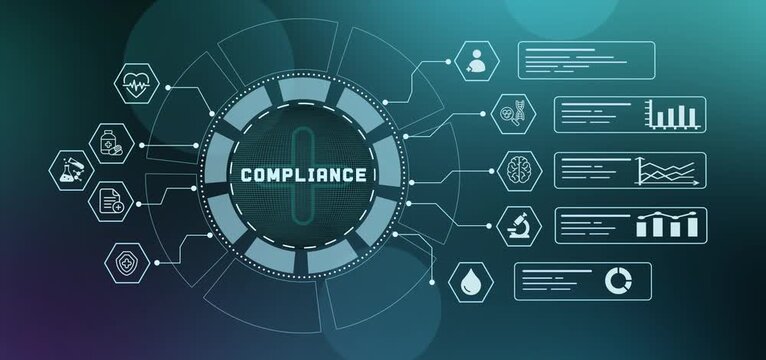
Enterprise healthcare compliance dashboard displaying regulatory data tracking and quality control metrics on HUD.
00:14
HD
Data visualization dashboard displaying global network performance metrics
00:13
HD
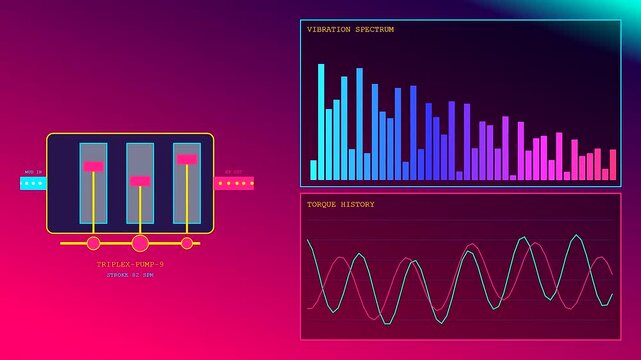
Digital displays showing geothermal drilling data with shifting vibration spectrum charts and fluctuating torque history graphs in a dynamic monitoring system for energy extraction process control
00:06
HD
Expense control concept visualizing expense, cost, and spending with emphasis on budgeting, cost control, and financial planning Marrow
00:10
HD
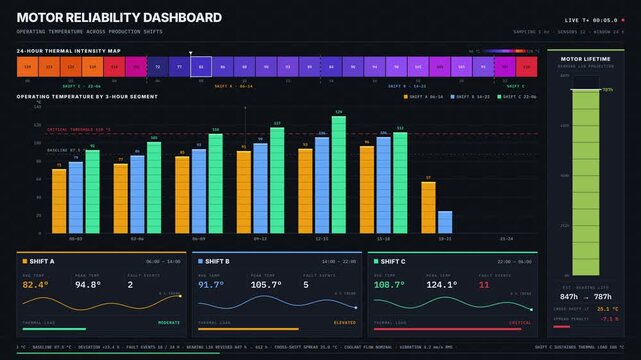
Explore the Motor Reliability Dashboard showcasing operating temperature variations across production shifts with vibrant color-coded visuals and dynamic animations.
00:15
HD
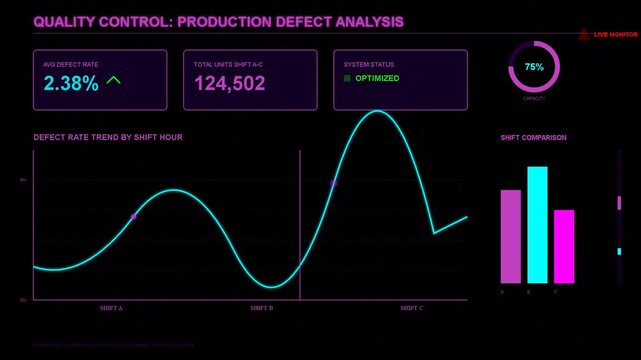
Digital dashboard showing quality control and production defect analysis with animated line graph and statistical bar charts
00:08
HD
Dark futuristic pyramid with a glowing red all-seeing eye and neon blue energy lines in a foggy night
00:06
HD
Data analysis interface blue gold icons analytics charts cloud network A circular hub connects cloud charts controls and reports for analytics branding and business presentations and social media
00:10
HD
Autonomous AI operations dashboard with agent workflow diagram telemetry charts and diagnostics
00:15
HD
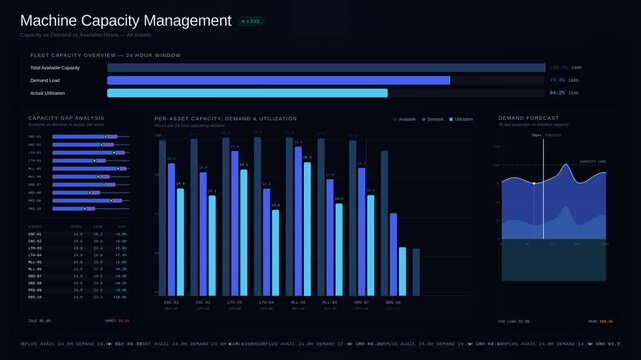
A visually engaging machine capacity dashboard showcasing utilization, production demand, and available operating hours with a modern design and animated bar charts.
00:15
HD
Profit and quality management concepts long term cost planning, product quality, budgeting, financial forecasting
00:14
HD
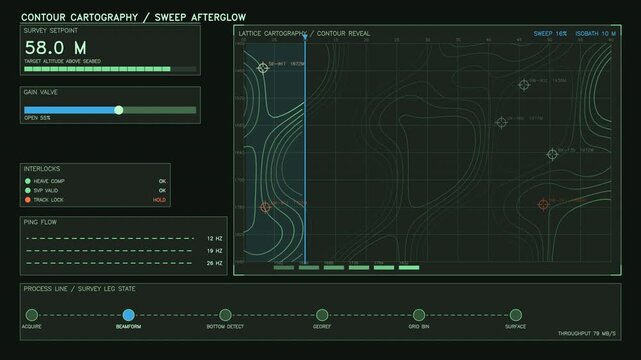
The screen displays a contour cartography interface showing survey data, gain values, and various parameters with interactive controls. It highlights graphical representation of terrain data
00:30
HD
Professional engineer monitoring complex data systems on multiple screens in modern control center. Male worker analyzing digital charts and graphs for security and automation performance.
00:13
HD
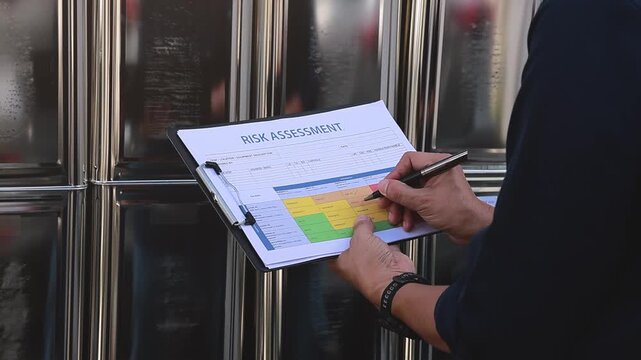
Professional conducting safety hazard identification risk assessment inspection writing on paper document clipboard near  solvent storage drums
00:13
HD
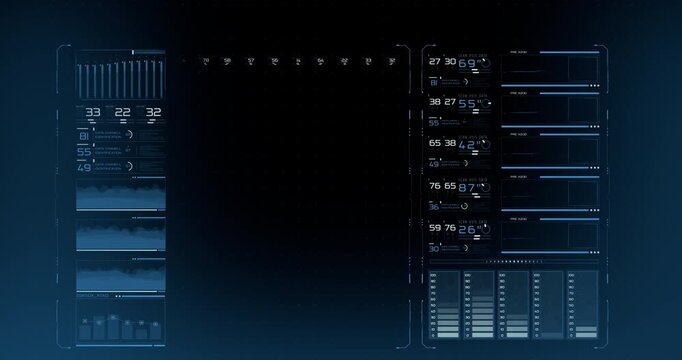
A dark futuristic HUD interface displays glowing blue data channels, numeric readouts and bar graphs across a high-tech control screen.
00:14
HD
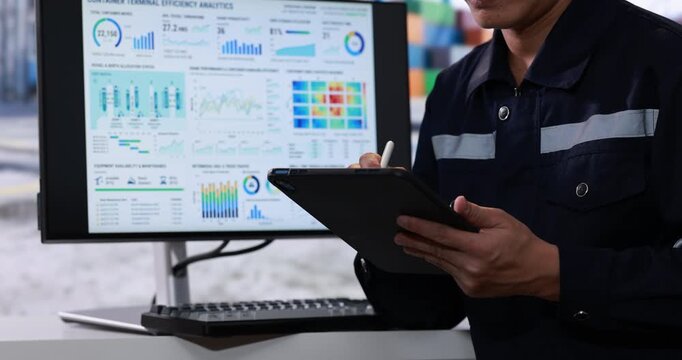
Industrial worker uses a tablet beside a computer monitor displaying colorful production data charts and performance dashboards in a factory office.
00:21
HD
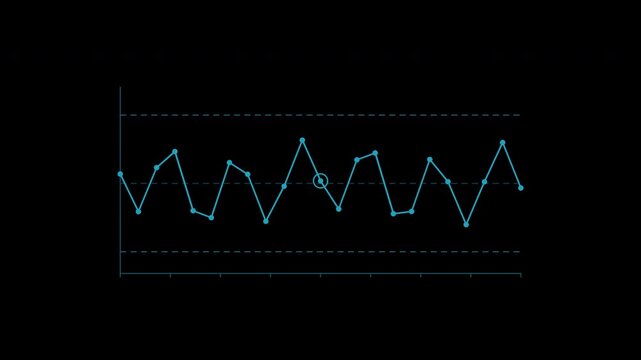
Quality control chart with upper and lower limits in cyan
00:10
HD
Corporate governance concept with enterprise compliance, intelligent business management, digital oversight and secure operational frameworks.
00:14
HD
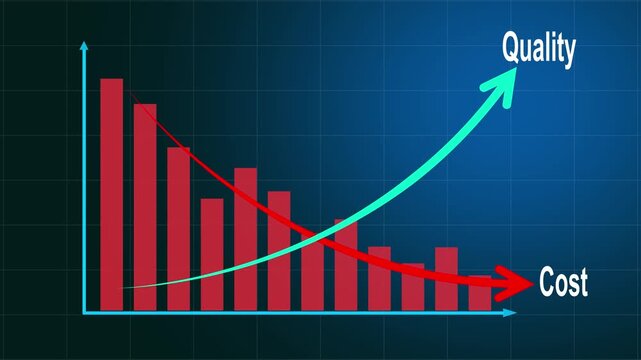
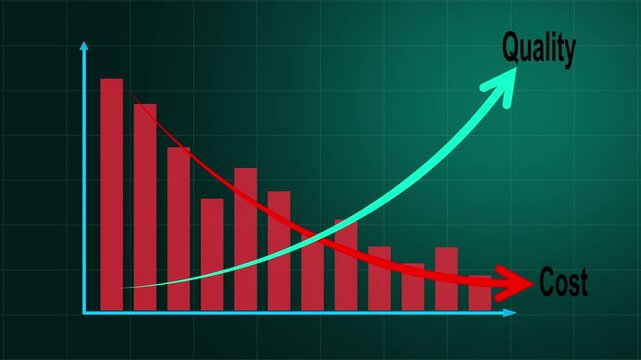
Cost control and quality improvement concept. Red bar chart with line graph showing cost reduction and improving quality. Successful business strategy, efficiency, product optimization and management
00:10
HD
4k ai claims analytics control plane dashboard with live pipeline stages, streaming charts approval metrics, for real-time processing workflow efficiency
00:20
HD
Dark store automation monitoring interface showing complex analytical data visualizations and live inventory tracking metrics on a digital display board within an industrial warehouse control room
00:06
HD
Interactive Technology dashboard combines globe charts and layers
00:14
HD
Female body silhouette highlighting estrogen concept animation isolated on white background
00:10
HD
Digital interface showcasing a checkmark symbol representing verification process alongside records, charts, and spreadsheets for quality assurance tasks. Gluon.
00:10
HD
Corporate professional typing credentials on a secure login interface with a digital shield icon. Concept of cyber security network protection, encrypted server access, and data privacy defense.
00:12
HD
Digital quality control dashboard interface with bar charts and data analytics for business performance tracking, metrics, monitoring, statistics
00:09
HD
abstract smart city technology background with modern office skyscrapers and floating digital analytics charts.
00:20
HD
Asian Female With Her Tablet at Financial Trading Control Room, Work Continuously With Her Tablet
00:15
HD
ROI return on investment concept. Neon line graph chart showing financial performance analysis with roi indicators, profit. Keywords: finance, graph, chart, business, economy, money
00:10
HD
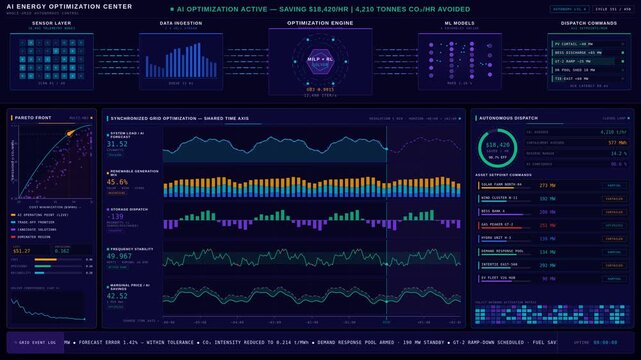
Futuristic AI energy optimization control center with glowing data analytics and autonomous decision dashboard in 4K. professional stock footage for technology, business, and editorial use.
00:15
HD
Developer typing after live data update, HUD bar charts and gauges floating, confirming result
00:09
HD
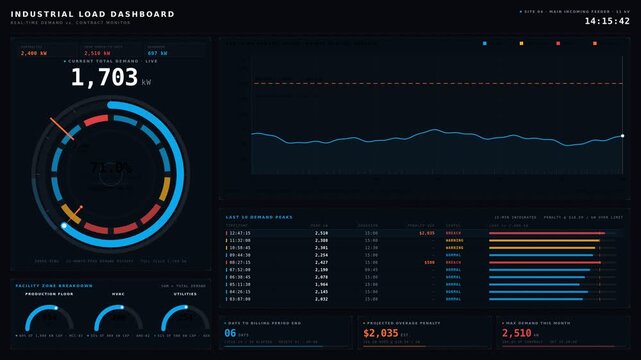
A detailed industrial load dashboard displays real-time demand versus contract limits with animated gauges and charts for monitoring energy usage efficiently.
00:15
HD
Professional engineer monitoring complex data systems on multiple screens in modern control center. Male worker analyzing digital charts and graphs for security and automation performance.
00:12
HD
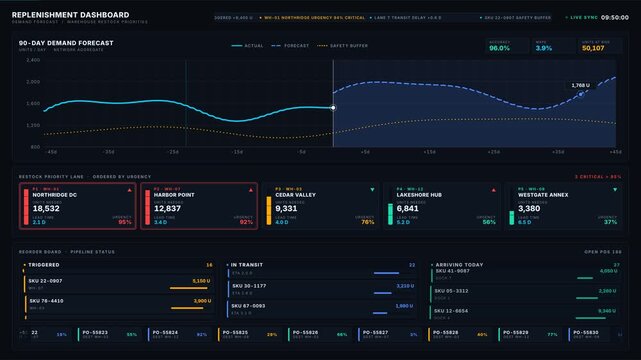
Explore a detailed replenishment dashboard showcasing demand forecasting and warehouse restock priorities with vibrant charts and dynamic Kanban boards in a sleek dark design.
00:15
HD
Digital stock market growth chart hologram projected in a modern data center, financial analytics and trading technology
00:08
HD
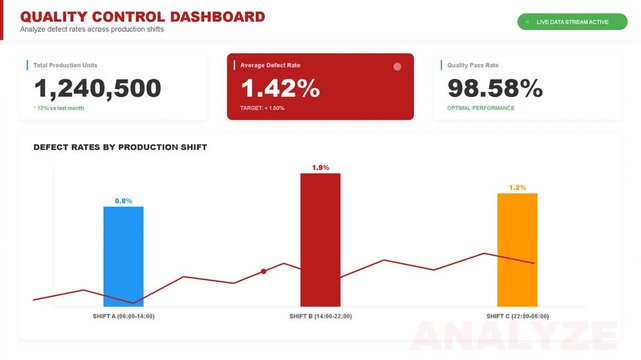
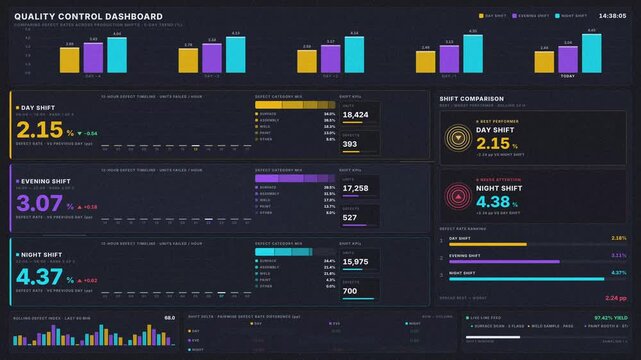
Analyze defect rates across production shifts using a dark-mode quality control dashboard featuring animated charts and KPI indicators in vibrant accent colors.
00:15
HD
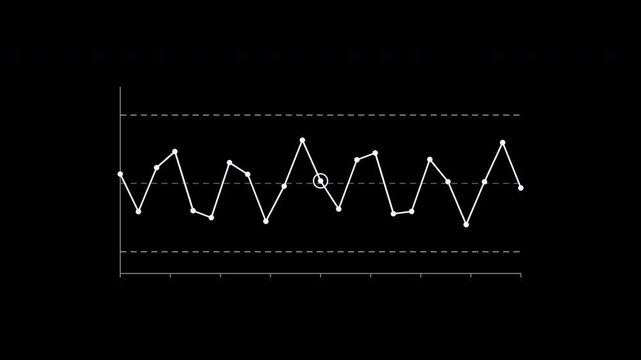
Quality control chart with upper and lower limits in white
00:10
HD
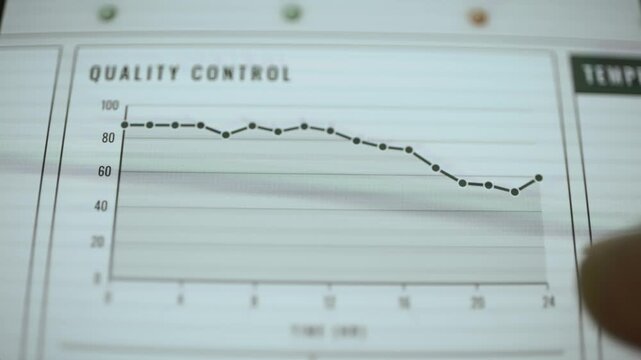
Quality control chart records changing defect rate
00:11
HD
A sleek, dark-themed digital dashboard displays line graphs, data metrics, and fluctuating charts indicating analytics trends
00:10
HD
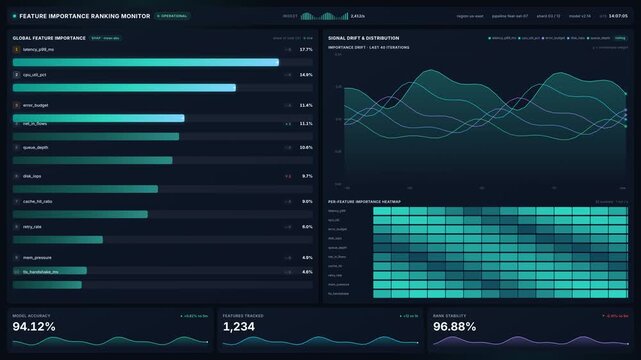
Feature importance ranking monitor interface with data charts metrics, for machine learning analytics, artificial intelligence performance, data science, system monitoring
00:20
HD
Cost control and quality improvement concept. Red bar chart with line graph showing cost reduction and improving quality. Successful business strategy, efficiency, product optimization and management
00:10
HD
Circular time chart becomes selected on household dashboard
00:10
HD
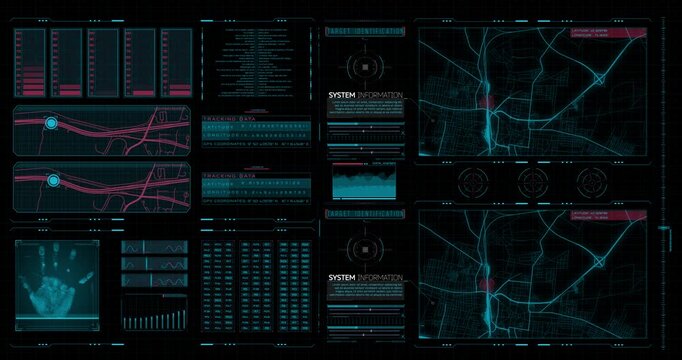
Futuristic digital interface displays city maps with marked locations, a hand scan, data charts and target identification elements.
00:30
HD
Futuristic dark mode dashboard interface, digital data visualization with colorful charts and graphs, modern UI UX software control panel
00:08
HD
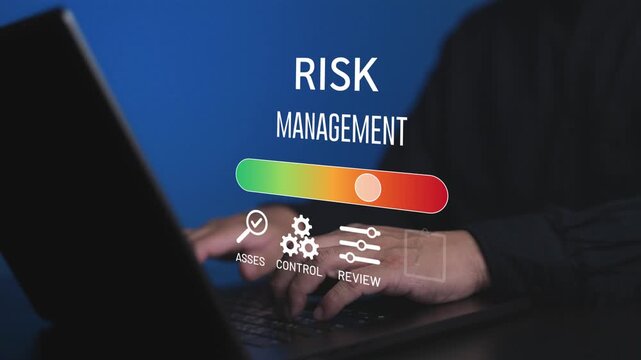
Business professional using laptop with risk management icon. Concept of assessment, control, and identification of financial or operational risks for corporate strategic planning.
00:10
HD
Digital fingerprint scans illustrate silicon security protocols with glowing circular ridge patterns and wave charts flickering across a dark interface screen inside a modern monitoring control room
00:06
HD
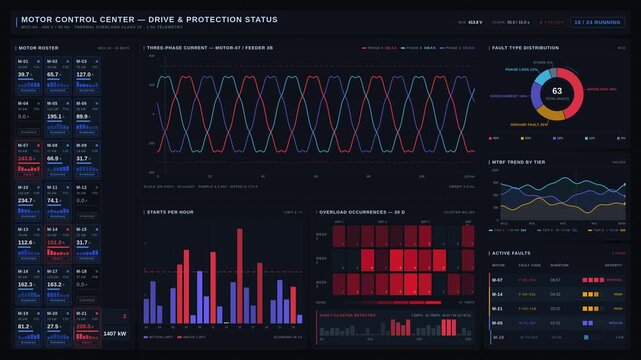
Motor control dashboard displaying current, faults, starts, and overloads with vibrant graphics and analytics for real-time monitoring of motor performance and status.
00:15
HD
Businesswoman hands using smartphone at office desk
00:08
HD
Futuristic holographic analytics display showing glowing data chart progression as a digital rocket launches from advanced control room console
00:05
HD
Explore a high-tech digital operations dashboard simulating factory scenarios with real-time data, featuring interactive charts and live sensor feeds for advanced monitoring.
00:15
HD
Two women doing fitness shoulder lifts in sync on starting rep HUD charts tracking metrics
00:12
HD
Institutional broadcast-style futuristic digital-asset price wave animation showing controlled bullish rise, acceleration, peak, and smooth pullback in 4K 16:9 seamless loop.
00:10
HD
Modern dark interface with glowing neon charts and graphs moving in a digital control panel
00:10
HD
Futuristic HUD dashboard interface with data analytics and charts
00:06
HD
Epidemiology monitoring dashboard mapping infectious disease outbreaks and public health transmission data.
00:14
HD
A dark mode production optimization dashboard visualizes forecasting output under changing operating conditions with a multi-scenario area chart and interactive elements.
00:15
HD
Quality control chart with upper and lower limits in teal
00:10
HD
Stock market graph animation displays upward rising financial trend lines. Revenue growth analytics track on graph. Investment consoles operate with market graph.
00:13
HD
Futuristic digital data dashboard with colorful charts and radar
00:12
HD
Digital quality control dashboard interface with statistical charts, performance metrics, and fluctuating data trends, business analytics and monitoring system
00:09
HD
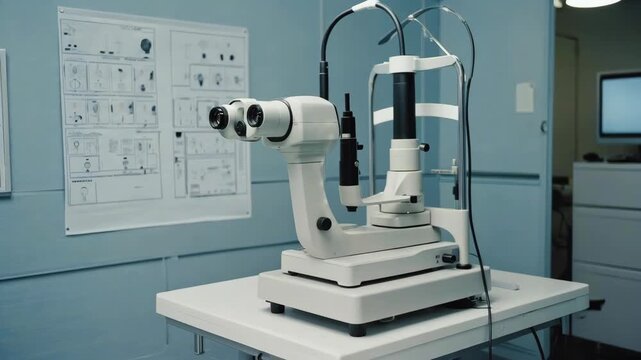
A professional operating microscope for eye surgery positioned in an ophthalmology clinic with anatomical charts on the wall.
00:10
HD
Overhead view of a diverse group of professionals in a business meeting using digital tools, analyzing data with charts and collaborating on innovative ideas for growth. Raster
00:20
HD
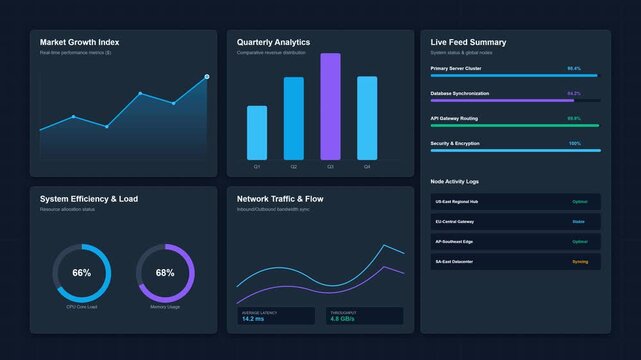
Professional 4K motion design dashboard featuring multiple synchronized financial charts, animated line graphs, progress bars, and minimal UI widgets in a seamless 6-second loop.
00:10
HD
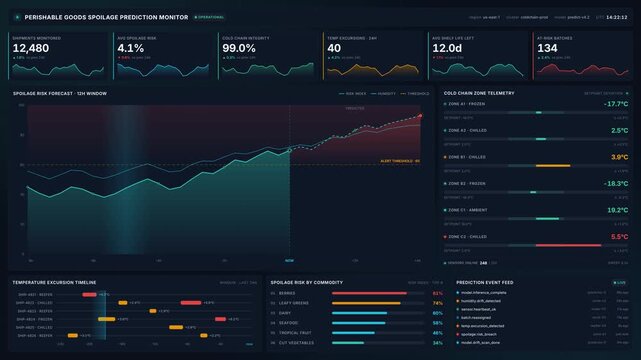
4k perishable goods spoilage prediction monitor dashboard with analytics, graphs, live telemetry data, for supply chain management logistics technology
00:20
HD
BPM business process management automation technology concept HUD interface with digital system icons
00:15
HD
Urban Planner Studies Zoning Map On Multiple Screens
00:23
HD
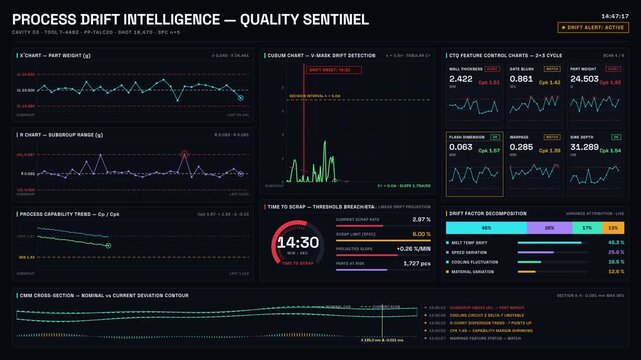
The Molding Quality Dashboard features advanced Process Drift Detection before Scrap Escalation, showcasing real-time SPC charts and alerts for manufacturing efficiency.
00:15
HD
Futuristic dark mode dashboard UI, digital data visualization interface with neon charts and graphs, modern software control panel design
00:05
HD
Abstract holographic AI analytics control glowing rotating charts neon lines futuristic cinematic surreal ethereal ambience cascading softly glowing abstract unique style
00:05
HD
Digital project management interface featuring animated Gantt charts and task scheduling timelines.
00:11
HD
Female nutritionist showing health charts on a clipboard during an online consultation about diet and wellness.
00:14
HD