Um link para definição da senha foi enviado para Para acessar suas compras no futuro, você precisará de uma senha.
Obtenha 3 vídeos ou 25 imagens com um teste grátis
Novos filtros adicionados
Classificar por

191.691 resultados para analytics graph em vídeos

Digital network data analysis future information technology Network Connections Nodes Social Media Content Complex Algorithms. AI Neural Network, Chatbot, Artificial Intelligence, LLM Visualization
00:20
HD
Top Down View of Diverse Business Team Gathered Around Meeting Table With Laptops and Statistical Reports. Visualization Icons Represent Connectivity, Cloud Security. Action Zoom out camera.
00:07
HD
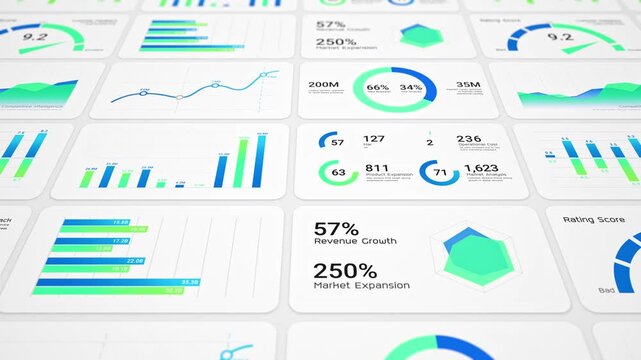
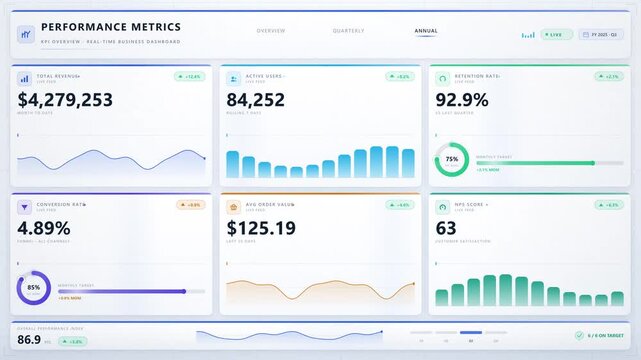
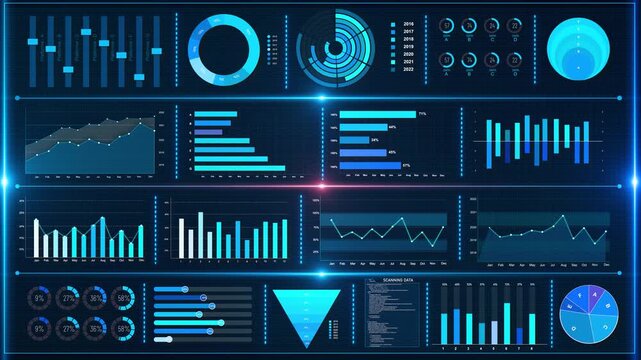
Modern Business Analytics Dashboard Animation with Multiple Data Visualization Panels like Charts, Graphs,  KPI Widgets, And Financial Statistics In A Clean Flat Design. Professional Website Metrics
00:49
HD
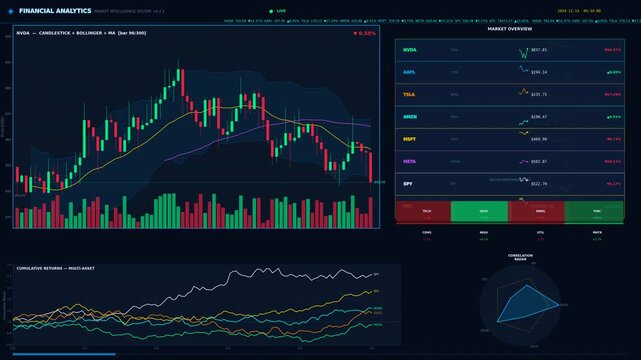
Financial chart background with rising bar graph and candlestick market data showing growth profit and upward trend animation
00:10
HD
A captivating visualization of dynamic financial growth featuring rising graphs against a city skyline backdrop, representing economic trends and market insights. Copula
00:10
HD
Fraud Analyst Monitors Transaction Network Graph On Laptop
00:17
HD
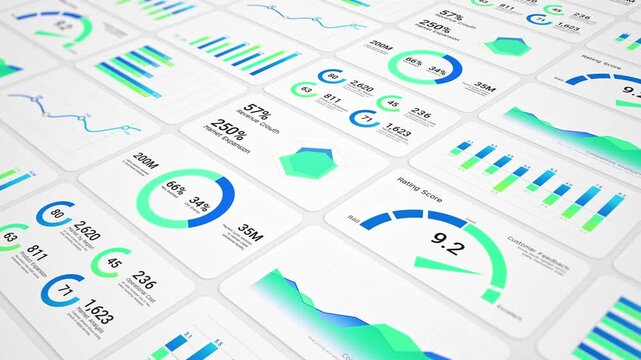
Business intelligence and financial performance analysis report on white background, animated infographic bar chart, investment data analytic graph dashboard, success corporate market statistics trend
00:20
HD
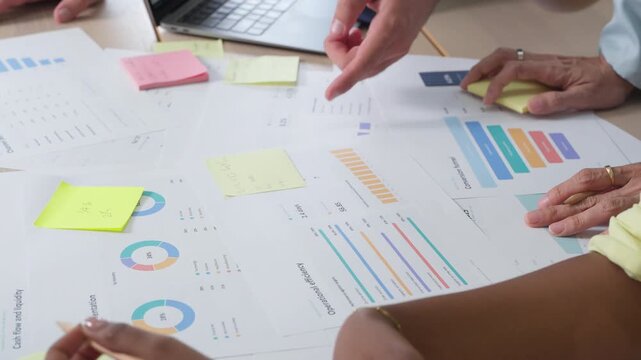
Overhead arc shot of office team analyzing financial graphs and documents during collaborative corporate meeting
00:12
HD
A detailed view of hands on a laptop and paperwork, colleagues collaborating over data charts in a fast-paced office meeting.
00:15
HD
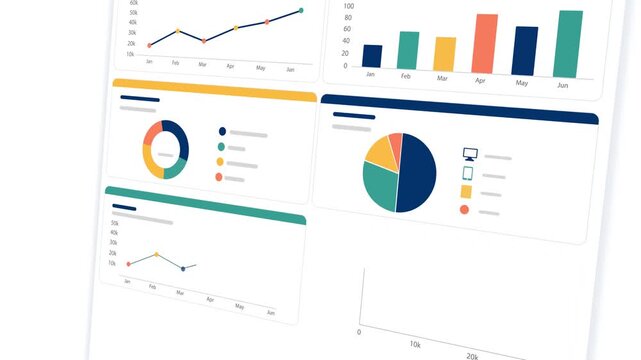
Business analytics dashboard with moving line chart, donut chart and bar graphs seamless loop, data visualization and reporting animation
00:06
HD
4k perishable goods spoilage prediction monitor dashboard with analytics, graphs, live telemetry data, for supply chain management logistics technology
00:20
HD
Animated horizontal line chart with glowing area fill showing positive business growth trajectory on dark background
00:08
HD
Business Innovation Light Bulb with Startup and Growth Icons
00:09
HD
woman analyst uses a computer AI artificial intelligence and dashboard for data business analysis and Data Management System with KPI and metrics connected to the database for technology finance,
00:10
HD
Close-up of financial charts displaying stock market data on a digital screen. Dynamic red and green graphs represent fluctuating stock prices in a modern trading environment.
00:10
HD
Smart city skyline of Chicago showing futuristic financial data, stock market infographics, business analytics, big data visualization over urban landscape
00:06
HD
Data flow streams converging into a live analytics dashboard with radar chart, bar graphs and system load
00:16
HD
Minimalist Financial Growth Curve Chart on Black Background
00:10
HD
Couple budget planning on finance dashboard online. They review savings and monthly expenses on a computer at home using charts analytics for smarter choices. Clear concept of home finance teamwork
00:08
HD
Hands working on a smartphone while graphs and icons are displayed on a screen representing data and analytics in business settings
00:10
HD
Financial Stock Chart Market Analysis Data Visualization financial data trends, price movement, analytics indicators. trading visuals, investment strategies, economic reports, fintech presentations.
00:20
HD
Top Down View Corporate Office With Multiethnic Workers at Computer Stations as Linked Visualization Layer Appears, Glowing Blue AI Icons, Cybersecurity, Connectivity and Workflow Automation.
00:10
HD
Digital analytics data background, glowing blue lines, dots, graphs, network. Represents business intelligence, financial growth, technology, innovation. Concept of big data, global communication


00:20
HD
Neon-style bar chart showing descending bars with downward arrow animation
00:10
HD
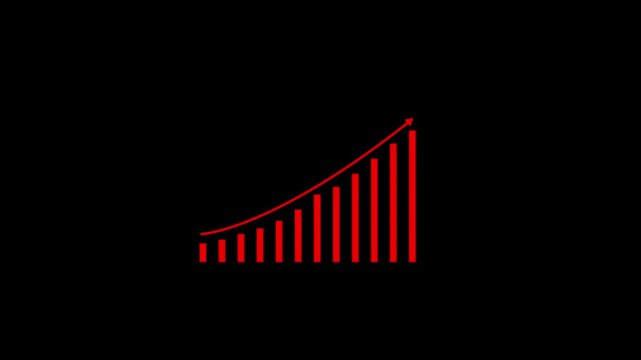
A vibrant red bar graph with a sharp upward trending curved arrow against a solid black background representing financial success and economic advancement
00:10
HD
Animated financial data graphs with moving sine waves and digital metrics for business analytics and market trends presentation
00:15
HD
Business intelligence and financial performance analysis report on white background, animated infographic bar chart loop, investment data analytic graph dashboard, enterprise market statistics trend
00:14
HD
2026 financial goal business growth planning investment future strategy success rocket lifts bar chart arrow upward showing ambitious planning and investment leading to measurable business growth
00:05
HD
Business team analyzing financial data and marketing strategy
00:20
HD
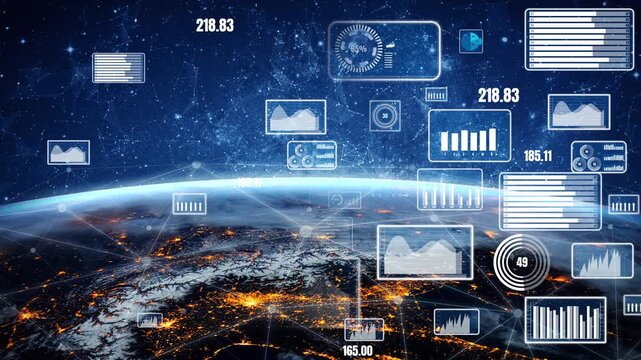
A stunning depiction of a futuristic digital data interface overlaying Earth, showcasing various graphs and statistics to illustrate global data trends and analytics. Xenic
00:10
HD
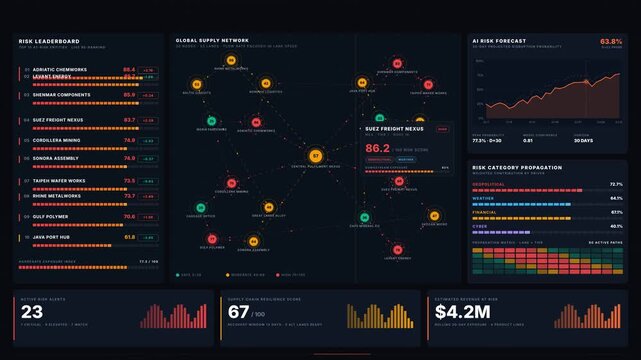
A dark-mode 4K risk analytics command screen showcases a global supply chain network graph with glowing nodes and animated risk indicators, highlighting potential disruptions and KPIs.
00:15
HD
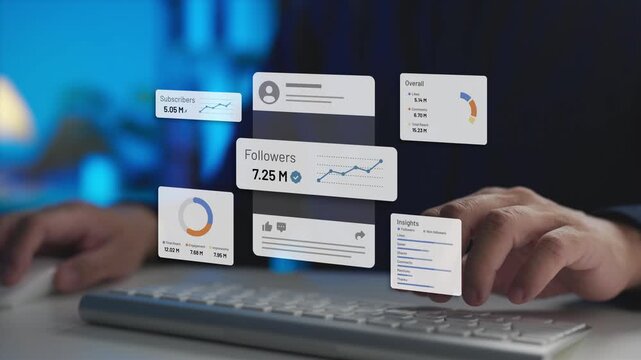
Monitoring social media follower growth and content engagement performance metrics on an interface. Concept of channel optimization, audience reach, and analytics dashboard.
00:12
HD
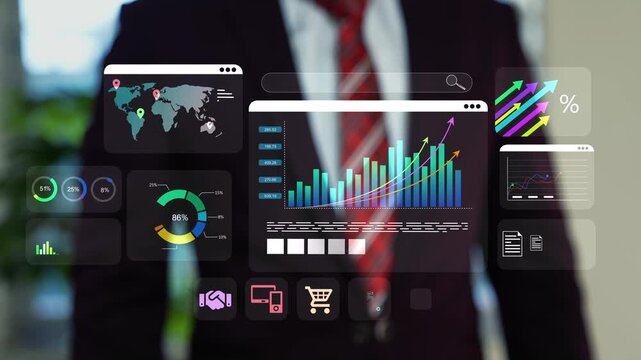
Businessman touching on hologram digital dashboard overlay showing graph charts, map and growth data animation, Holographic modern business analytics, finance planning and market performance
00:10
HD
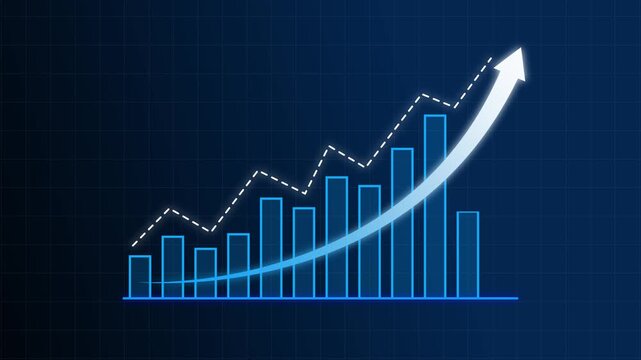
Bar graph animation with dashed line. Bar graph blue upward trend on grid. Bar graph business statistics graphic on black background for performance tracking.
00:11
HD
Animation of multiple charts visualizing the analysis of large amounts of data
00:14
HD
Data Analyst analyze Data Financial Dashboard and Touch screen Monitor.
00:13
HD
Data pipeline converges raw data streams into glowing lines that feed live analytics dashboard panels
00:16
HD
Digital data graph with glowing blockchain network and modern finance technology background
00:10
HD
Motion animated footage. Statistics bars columns growth, arrow up. Finance, Bar graph going up, Profit concept, positive increase chart. business graph animation
00:10
HD
Business graph growth concept in allusive graph chart showing marketing sales profit increasing to future target. Excellent financial status of corporate business going up.
00:12
HD
High tech interface screen circular HUD display, charts, graphs analytics panels background. data monitoring system visualization for technology presentations dashboards cybersecurity innovation media
00:20
HD
Side Profile Portrait of Stockbroker at Desk Looking at Computer Screens Showing Stock Exchange Data, Equity Charts, Investment Analytics, Asset Management, Financial Graphs to Track Market Trends
00:16
HD
Dynamic business dashboard UI interface design vector illustration showing financial analytics charts and modern motion render graphics
00:10
HD
Business meeting with laptop displaying analytics dashboard charts, graphs in corporate office. Professional team presentation, data visualization statistics, performance reporting, strategy planning
00:09
HD
Close up of businesswomen or accountant using calculator calculate while working analytic business report on the workplace, Planning financial and accounting concept.
00:12
HD
Oil Industry Growth Visualization with Graphs and Icons
00:10
HD
Stock market ticker terminal screen showing multiple live trading graphs and financial charts
00:30
HD
Modern business data analytics dashboard animation showing high growth with 3D bar chart display
00:10
HD
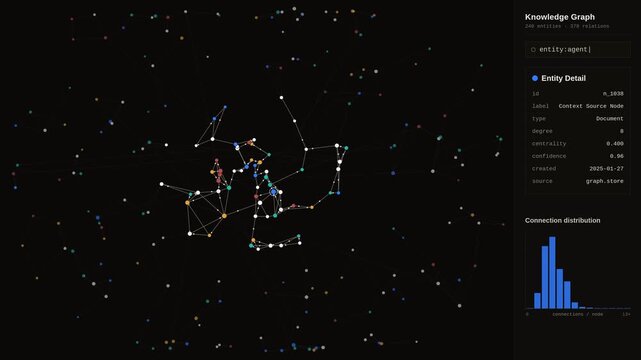
Dark-themed knowledge graph visualization dashboard with color-coded nodes and interactive sidebar interface. professional stock footage for technology, business, and editorial use.
00:15
HD
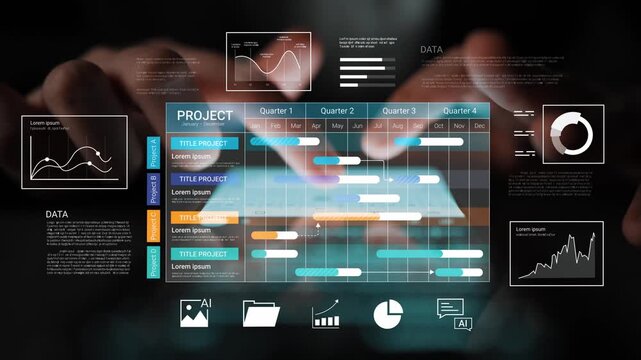
Interactive Data Visualization Dashboard with Project Management Metrics and Analytics for Business Review and Planning in Modern Office Environment Gluon.
00:10
HD
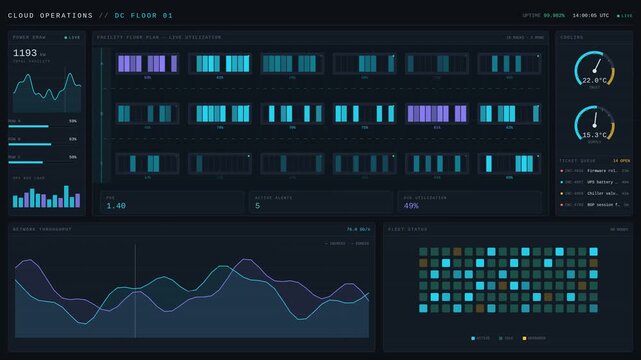
Digital data center cloud operations dashboard displaying real time analytics
00:15
HD
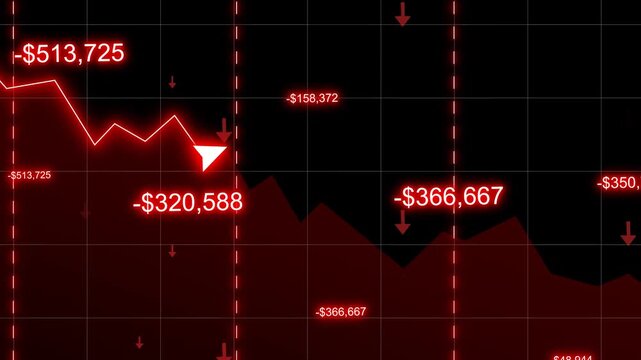
Financial Loss Graph Animation Showing A Dramatic Stock Market Crash With Falling Red Chart Line, Negative Dollar Values, Downward Arrows. Concept Of Economic Recession, Volatility, Investment Failure
00:19
HD
Animated bar chart with rising trend arrow showing business growth and financial success
00:05
HD
Abstract digital project management board with interactive task cards and notifications on a dark purple background
00:10
HD
Financial market chart with candlesticks and line graph, Abstract financial chart with candlestick bars and line graphs market analysis growth and data trends animation
00:10
HD
Industrial business concept with rising financial graph overlaying oil refinery plant at night. Symbolize increasing oil prices, refinery operating costs and growth in global power and energy sector.
00:18
HD
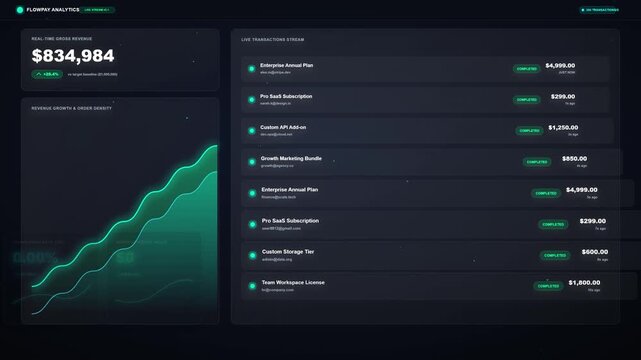
Business overview dashboard with revenue profit sales charts and KPI metrics on dark screen
00:15
HD
Over shoulder shot of Caucasian young adult woman analyzing business metrics and scrolling through dashboard analytics on laptop. Clip perfect for marketing campaigns about remote work and e-commerce
00:08
HD
Digital line graph tracks upward moving corporate revenue. Interactive line graph demonstrates successful financial forecasting. Economic growth concept with corporate line graph.
00:10
HD
Person using a calculator and laptop, reviewing printed financial charts and reports on a desk, performing budgeting and data analysis in an office setting
00:05
HD
Futuristic Data Analytics Dashboard Screen digital dashboard displaying charts, graphs, statistics, analytics interface. for finance visuals, business reports, corporate presentations, data analysis
00:19
HD
Slow Dolly-in Through a Stock Exchange Asset Management Firm, Where a Stockbroker Ceo Studies Live Charts, Weighing Banking Decisions, Strategy and Capital Growth for Corporate Career Success
00:13
HD
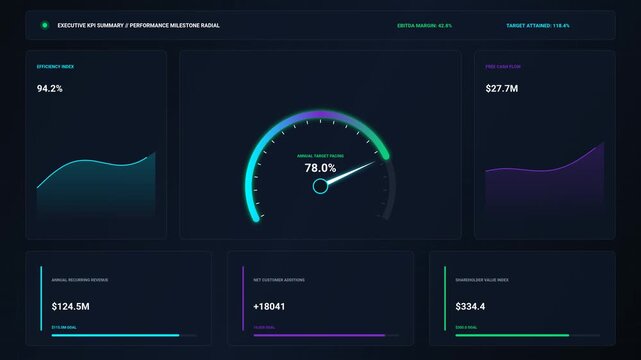
Modern Business Intelligence KPI Dashboard with Radial Performance Gauge
00:10
HD
Minimalist Animated Financial Graph Showing Upward Trend on Black Background
00:10
HD
Analyst businesswoman reviews finance data reporting dashboard. She works at dual monitors reviewing charts, spreadsheets, and graphs for budgeting. Clear data analysis and financial reporting
00:10
HD
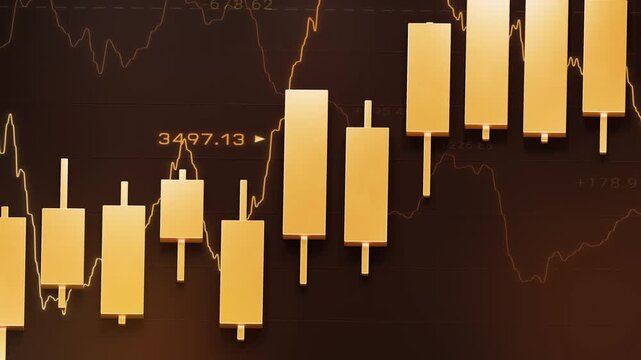
Golden candlestick bar floating with technical line chart, gold trading investment strategy, bullrish commodities market price trend graph, uptrend financial economic growth profit 3d rendering
00:18
HD
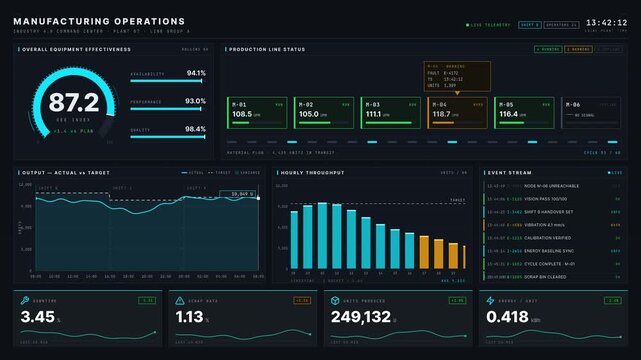
A detailed overview of a dark-mode Industry 4.0 command center dashboard featuring real-time OEE metrics, production line status, and KPI cards in a corporate environment.
00:15
HD
Team meeting around desk, seated man tapping laptop causing animated charts showing business growth
00:12
HD
Financial stock market graph loop animation with HUD data and growing business chart background
00:19
HD
Close-up of hands typing on a keyboard with a digital graph overlay showing upward trends, symbolizing business growth and the influence of technology in data analysis. Copula
00:10
HD
Animated bar chart graph rising and falling financial animation
00:12
HD
Business growth roi increase with ai integration system development reduce cost improve efficiency successful corporate strategy innovation project management strategic planning corporate progress
00:05
HD
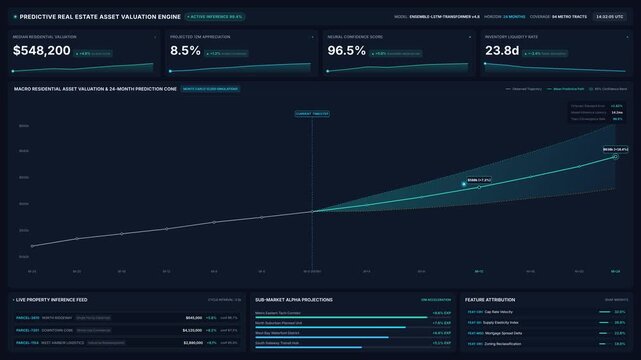
Financial analytics dashboard with real estate valuation engine market forecasting data, for asset management, investment planning, market research, economic data analysis
00:20
HD
Business colleagues collaborating on a financial report, analyzing marketing data charts, and discussing company investment strategy during a corporate meeting in the office
00:22
HD
Declining bar chart with downward trend, Blue bar chart with falling line graph decline in business data, finance performance and analytics animation
00:07
HD
Businessman analyzing financial charts, counting coins, and using a calculator to evaluate asset sales and profits.
00:23
HD
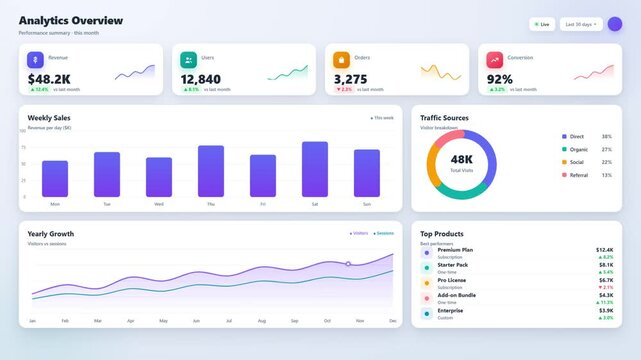
Analytics dashboard interface showing revenue charts user metrics and traffic data visualization
00:10
HD
Financial chart overlays power plant and oil refinery, symbolizing global energy economic growth. Represent rising market prices, increased production and demand for petroleum and power generation.
00:18
HD
Business stock market trading graph growth chart concept Infographics animation rising up arrow. Futuristic Data Analytics Dashboard statistics finance visuals business reports, marketing sale profit
00:15
HD
Finance growth chart graph stock market upward data analysis business abstract background with rising green line over bar graph showing market trend investment statistic concept digital chart
00:10
HD
Financial chart background with rising bar graph and candlestick market data showing growth profit and upward trend animation
00:10
HD
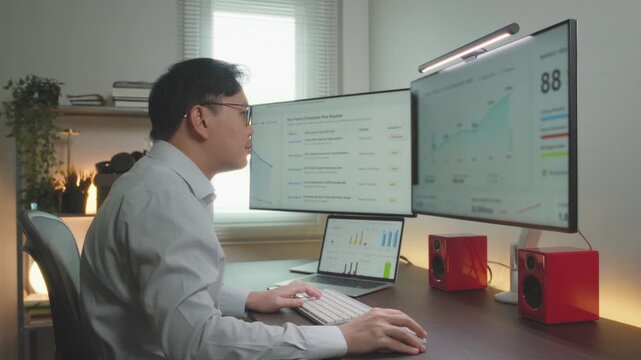
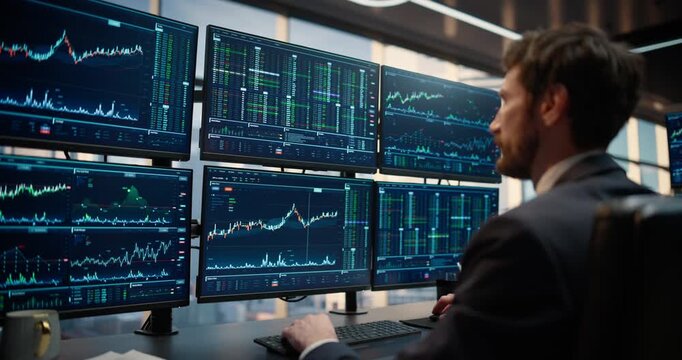
Over-the-shoulder View of a Male Trader Working at a Multi-monitor Desk Displaying Stock Exchange Data, Equity Charts and Market Analytics for Investment, Capital Growth. Asset Management Company
00:06
HD
Fraud Analyst Reviews Real-time Transaction Patterns
00:21
HD
Neon Glowing Upward Growth Graph Chart on Black Background Minimalist Concept
00:08
HD
Animated gradient bar graph showing growth and data visualization on dark animation 4k background business
00:10
HD
Businessman manager analyst reviewing analytics spreadsheet charts. In office he analyzes data on laptop and screen preparing reports and checking metrics. Core analytics and reporting concept.
00:09
HD
Hand placing a bar on a chart while displaying various types of graphical representations, concepts of data analysis, financial growth, and business strategy
00:17
HD
Reviewing business report on digital tablet
00:17
HD
Technology Data analysis for business and finance graphic interface showing, Online marketing research, and Information report for business strategy.
00:25
HD
A professional analyzing business data through an interactive digital interface, showcasing various graphs and metrics in a modern workspace setting. Cipher
00:13
HD
Different UI, UX, GUI mobile screens modern infographic. Template dashboard infographic, charts, graph and graphic UI, UX, KIT elements. Info chart elements for online statistics and data analytics.
00:15
HD
A professional businesswoman working in a modern office, interacting with a holographic interface displaying financial charts, stock growth graphs, and digital market research data, floating dashboard
00:05
HD
A man sitting at a desk in front of multiple computer screens displaying various graphs and charts, analyzing financial data or technical information.
00:05
HD
Dynamic email marketing animation with envelopes, graphs, and vibrant colors representing campaigns
00:20
HD
Declining bar chart with downward trend, Blue bar chart with falling line graph decline in business data, finance performance and analytics animation
00:08
HD
ASCII Radio Signal Wave Background Animation
00:10
HD
Business analytics dashboard animation with revenue charts user metrics and traffic donut graph
00:15
HD
Businessman analyzing financial charts, counting coins, and using a calculator to evaluate asset sales and profits.
00:14
HD
Abstract grey growing financial linear graph chart background. Seamless looping tech motion design. Video animation Ultra HD 4K 3840x2160
00:20
HD
The beautiful businesswoman in glasses on the hologram background
00:22
HD