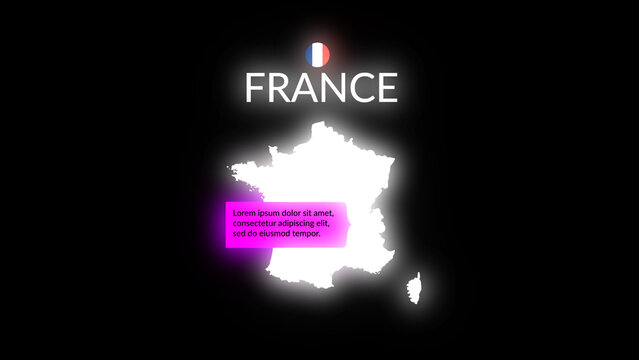
HUD Neon Maps Country Map Testimonial (210 Flags, 195 World Countries Maps Included)

Ui Futuristic Upload Progress Bar

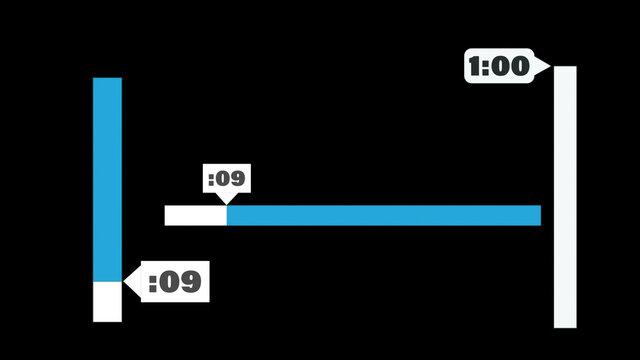
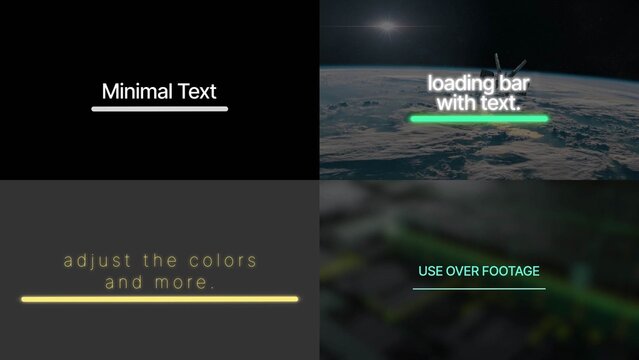
Fast Loading Bar Animated Text Title with Quick Progress Intro

Round Modern Progress Bar

Loading Bar Overlay

Project Schedule Timeline Infographic Template with Slide Bars Minimal Design
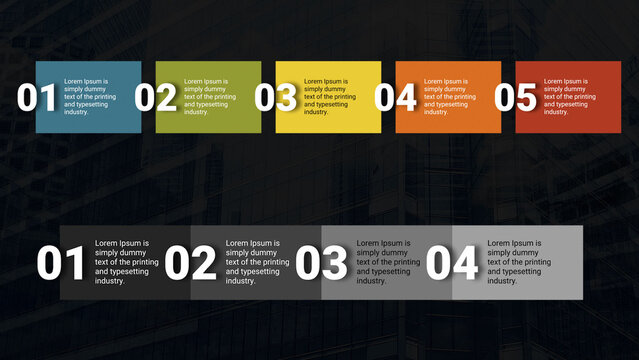
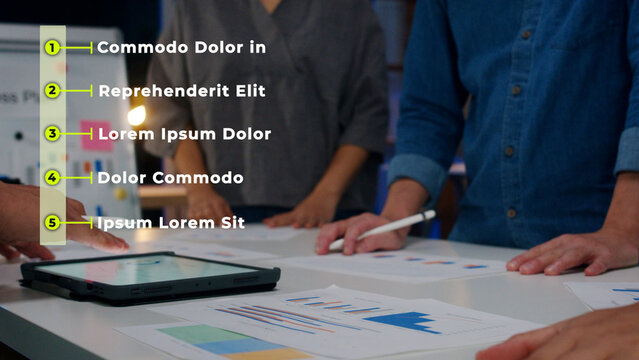
Horizontal Sliding Text Blocks With Large Initial Letters

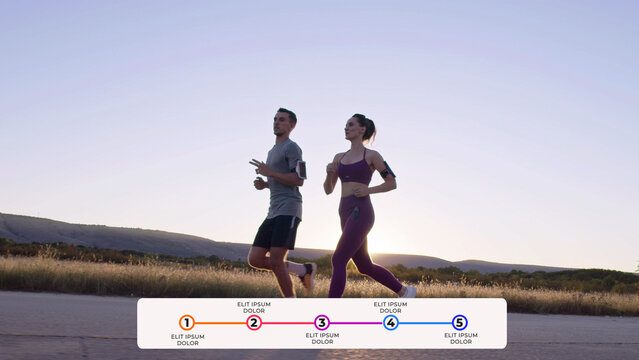
Editable Business Gantt Chart Timeline Infographic Template with 5 Steps Progress Bars and Project Management Icons for Annual Reports.

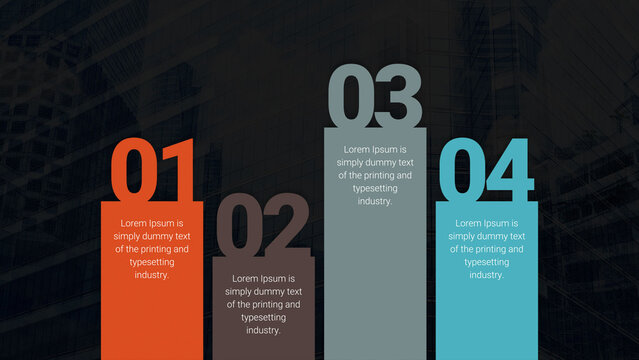
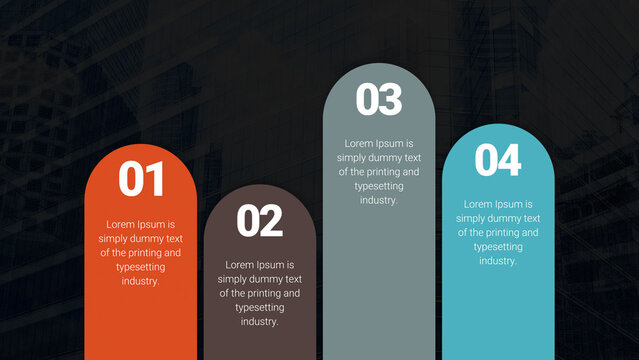
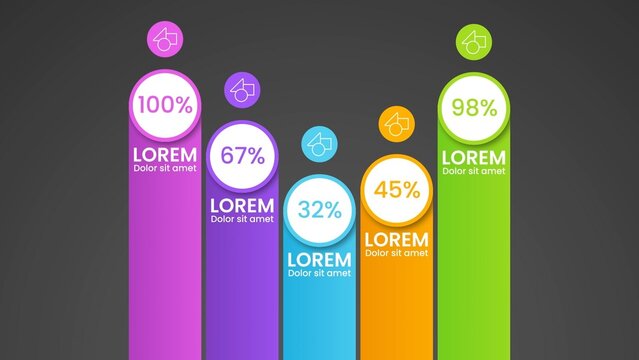
Modern 3D Bar Chart Infographic template with 5 steps on Dark Background

Hexagonal Bar Graph Infographic Layout
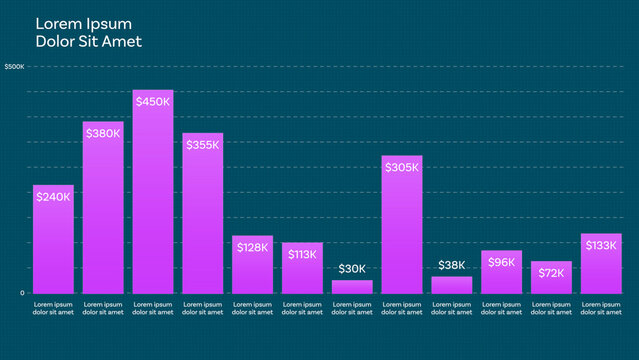
Responsive Vertical Bar Chart for Design and Data Visualization Design and Slide Presentation and with 12 Animated Data Points + Custom Text + Color with Dual Bar Graph Mode and Dynamic Auto-width Bar
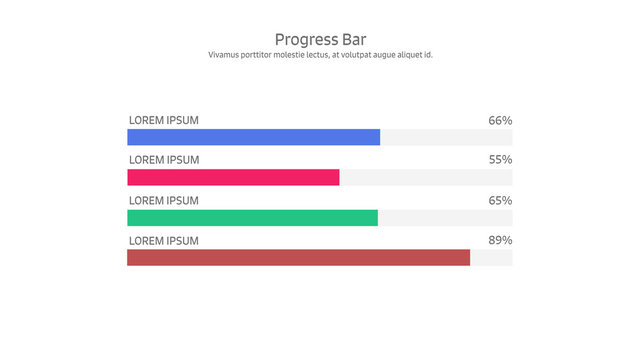
Progress Bar Infographic
10 Percentage Infographics

Loading Screen Overlay
GRÁTIS
Loading Bars Title Pack

Step Infographics 03
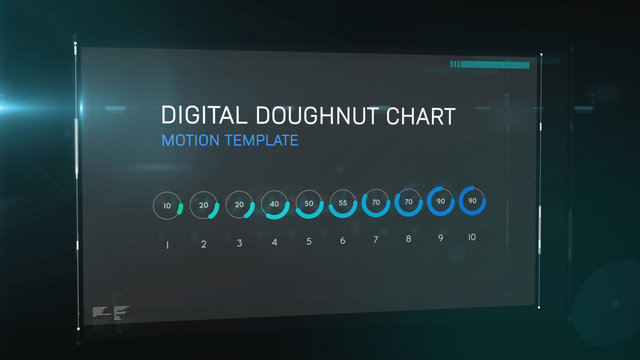
Digital Doughnut Chart

Social Media Overlay Title

Business Growth Infographic Template with Success Presentation

Modern Graph Chart Layout with Infographic Progress Bars

HUD Neon Maps Country Map Chart (210 Flags, 195 World Countries Maps Included)
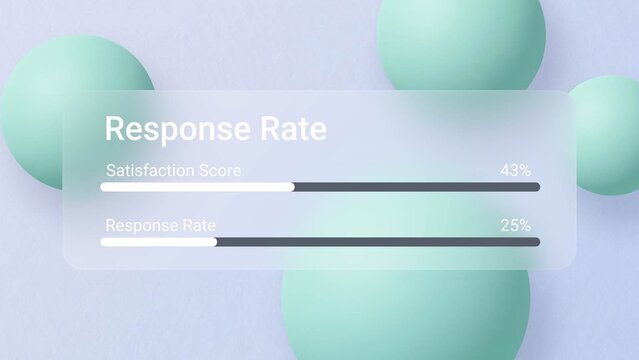
Response Rate Bar UI Card
8-Bit Loading Screen Text Intro with Retro Pixel Art Style
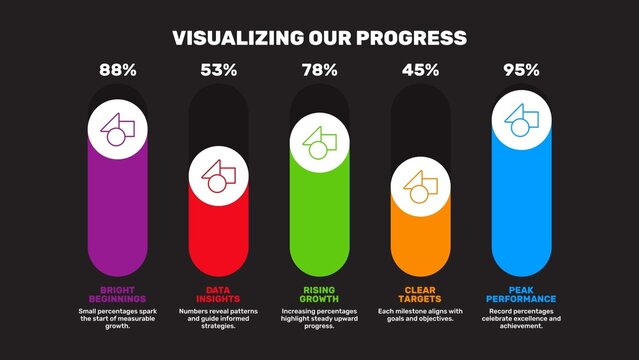
Bar Slider Professional Performance Tracker Infographic

Minimal Media Replacement Loading Bar Animation

Progress Bar Infographic Template with Minimal Illustration
Bar Chart Graph Infographic Template for Data Graphs in Business Presentation Layouts
Editable Business Timeline Infographic Bundle Template with Staircase Diagram, Arrow Process and Horizontal Progress Bars in Colorful Design.
Circular Loading Progress Bars Set
Isometric Triangle Bars Info Chart Layout
Smile Rating Infographic
Purple Artificial Intelligence Infographic Ai Charts Technology Layout Set
Financial Data Infographics Layout Template

Video Player Overlay With Progress Bar And Buttons

Simple Video Progress Bar Overlay
Step Infographics 01

Loading Bar
GRÁTIS
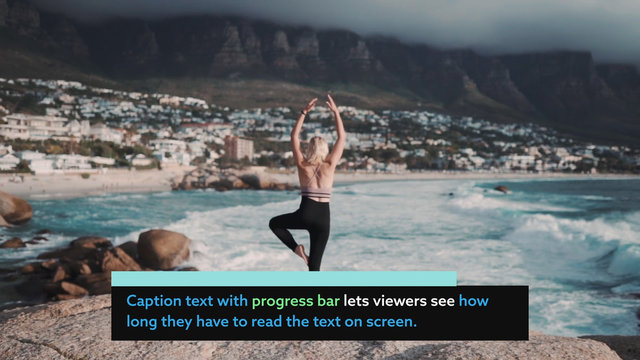
Caption Progress Bar Title Overlay
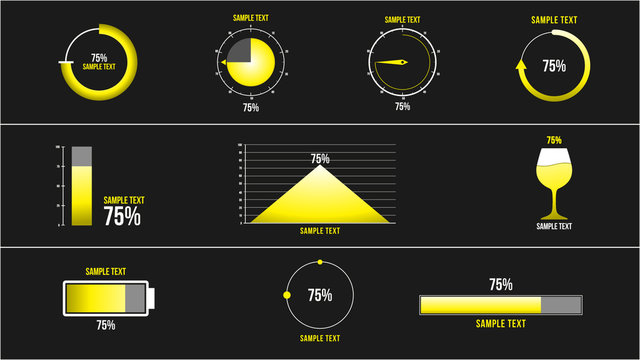
Yellow Accent Element Eight Page Infographics Layout Kit
Reseme Layout with Dark Red Accents and Gray Sidebar
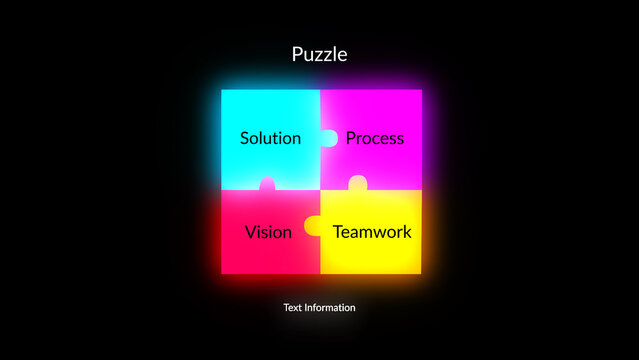
HUD Neon Icon Graph Puzzle
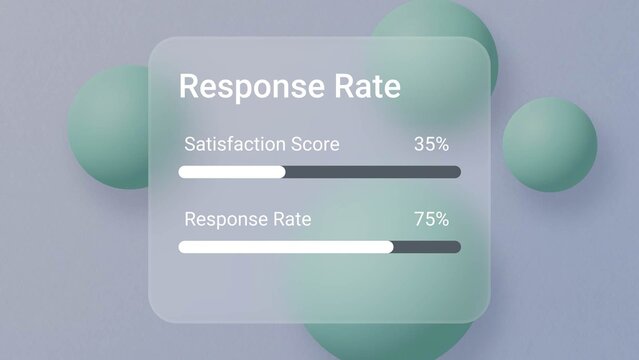
Response Rate Ui Card

Loading Bar Animated Text Title with Subtitle and Progress Indicator
Modern Design Infographic Data Visualiser Graph

Minimal Loading Bar Animation for Text
Project Steps Infographic Template with Newton Cradle
Bar Chart Graph Infographic Template in Modern Corporate Style for Business Presentations
4 Steps to Business Challenges Success Path Infographic Presentation with Blue Accents
Vertical Infographic timeline template with rounded color content blocks with icons on dark background
Hexagonal Progress Bars Infographic 1
Charts and Diagrams Icons Set
Colorful Modern Business Infographic Data Statistics Presentation Template
Website Landing Page Financial Business Growth with Coins and Upward Arrows
Modern Business Process Infographic With Steps And Large Text 01
Website Landing Page Design Template

Step Infographics
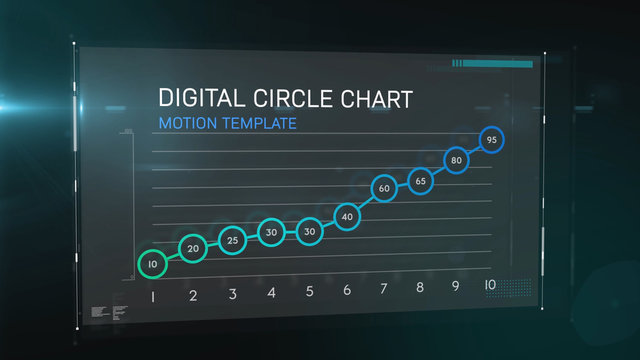
Digital Circle Chart
Timer Progress Bar Title Overlay
Gear Element Eight Page Infographics Kit
Project Planner With Progress Bar
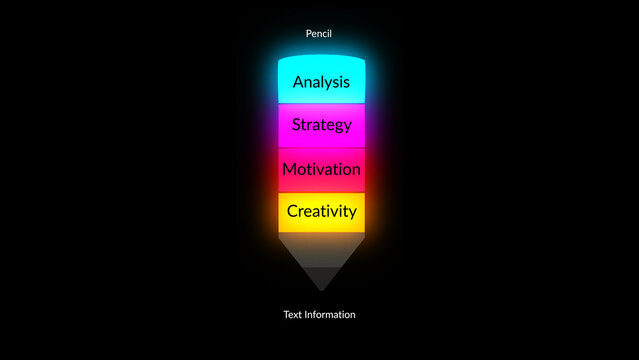
HUD Neon Icon Graph Pencil
Customer Satisfaction Progress Bars

Loading Bar Logo Reveal for Tech Startups and Gaming Channels

Countdown Rectangle Timer Bar 60 Seconds Infographic
Minimal Loading Bar Animation for Text
Project Progress Infographic Template with Bars
Bar Graph Infographic Template
Technology Infographic Design Template
Isometry steps template in two directions - multipurpose infographic
Stairs Bar Infographic
Growth Arrow Infographic Template Design
Black White Collaborative Teamwork Progress Infographic Template
Project Schedule Infographic Template
GRÁTIS
Modern Business Process Infographic With Steps And Large Text 02
Charts and Diagrams Icons Set
Step Infographics

Social Media Progress Bar

Video Cut Out Progress Bar Title Overlay
Corp Minimal Professional Landing Page Wire frame Layout Template
Resume Layout with Large Header and Green Accents
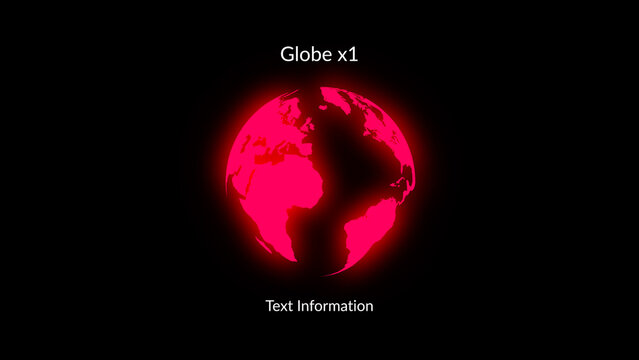
HUD Neon Maps Globe Outside x1
Goal Completion Progress Meter

Neon Loading Bar Logo Reveal for Social Feed Ads and App Launch Posts
Gradient Graphic Bar Value Comparison Infographic

Loading Bar Overlay
Project Schedule Infographic Template with Colorful Bars
Minimalist Bar Graph Infographic Template
Modern Business Planning Project Timeline Infographic Presentation Template
Modern Infographic Layout Design Template with Vertical Bars
Positive Negative Bar Graph Infographic
Data Analysis Landing Page with Isometric Bar Graph on Smartphone, Business People Analysis the Data and Financial Web Graph Screen
Dark Blue And Light Blue Corporate Business Circle Infographic Template
Game UI and HUD Elements Vector Set Buttons, Icons, Scrolls, Coins, Skills
HUD Neon Infographics Line Number x1
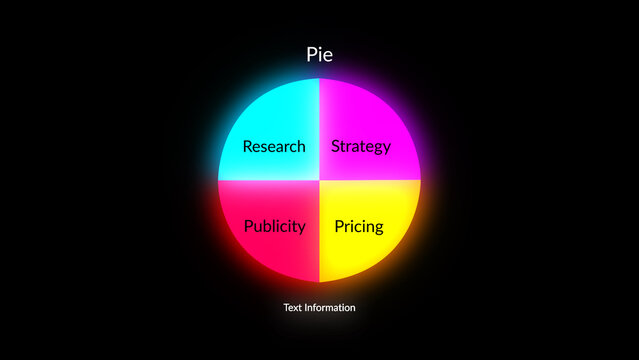
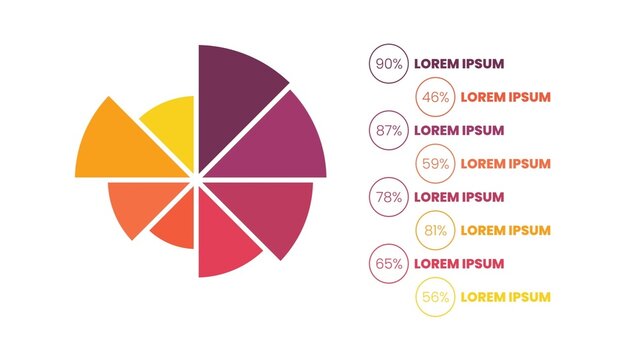
HUD Neon Icon Graph Pie
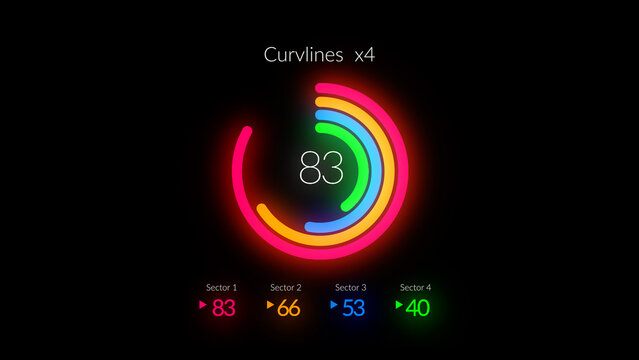
HUD Neon Infographics Curve Lines x4
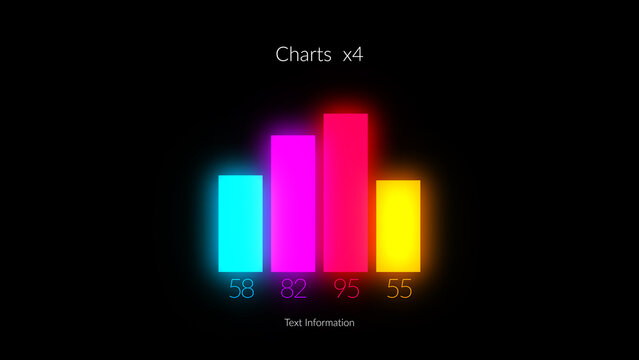
HUD Neon Infographics Chart Bars x4
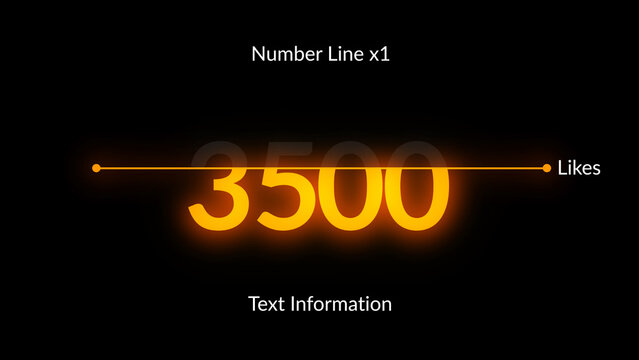
HUD Neon Icon Graph Number Line x1
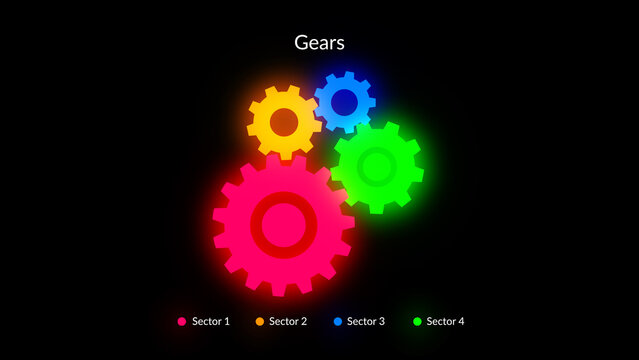
HUD Neon Icon Graph Gears
HUD Neon Maps Globe Pie