Een koppeling om je wachtwoord in te stellen is verzonden naar: Als je in de toekomst toegang wilt tot je aankopen, heb je een wachtwoord nodig.
Krijg 3 video's of 25 afbeeldingen bij een gratis proefperiode
Nieuwe filters toegevoegd
Sorteren op

4.920 resultaten voor candlestick pattern in video's

White Japanese candlestick chart on dark blue gradient field. Financial white Japanese candlestick chart for stock trading analysis. Corporate white candlestick chart.
00:10
HD
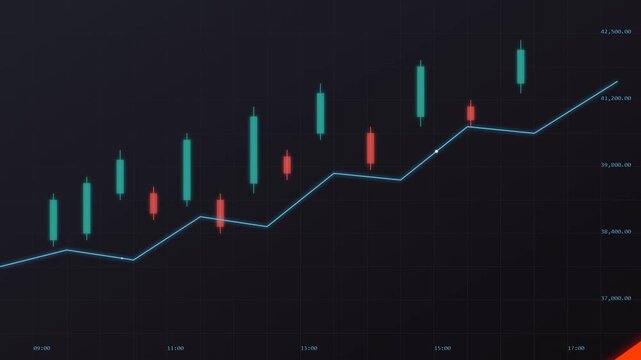
Abstract Digital Financial Trading Chart with Candlestick Patterns and Moving Average Lines on Dark Background
00:20
HD
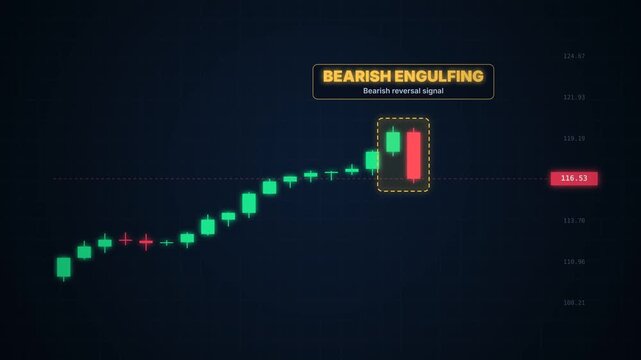
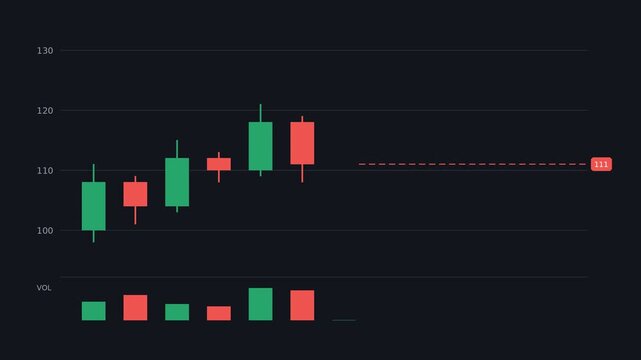
Bearish engulfing candlestick pattern forming after uptrend, bearish reversal signal
00:08
HD
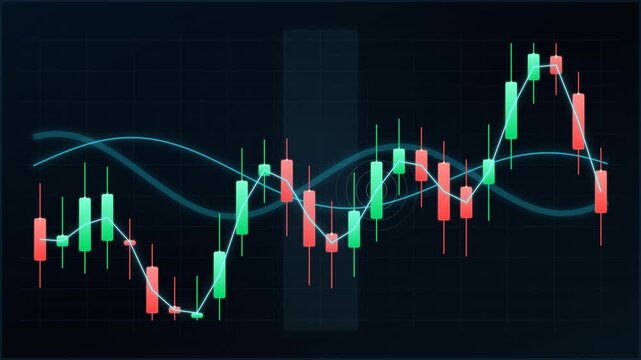
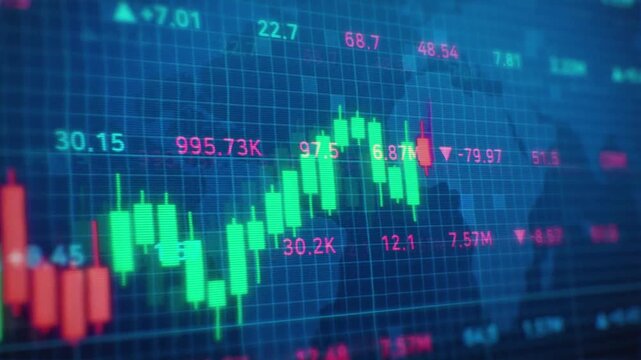
Futuristic financial stock chart with glowing blue and red candlestick patterns on dark grid screen, representing market analysis and crypto investment strategies for fintech app designs, trading
00:10
HD
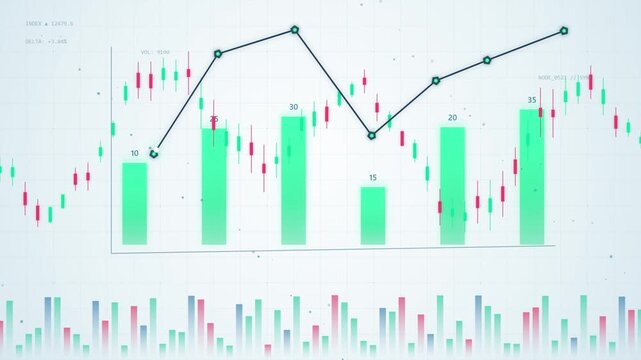
Financial market chart with candlesticks and line graph, Abstract financial chart with candlestick bars and line graphs market analysis growth and data trends animation
00:10
HD
Financial stock market chart showing red candlestick patterns with glowing white trend lines moving
00:06
HD
Abstract digital financial stock market chart with glowing candlestick patterns on a dark blue background.
00:10
HD
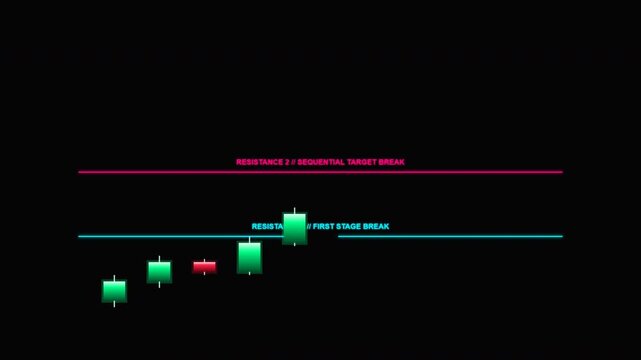
Candlestick Trading Pattern Showing Market Liquidity and Breakout
00:12
HD
Minimalist financial candlestick chart pattern isolated on a black background
00:10
HD
Animated stock trading candlestick chart featuring a classic 'M' pattern or double top reversal that builds exhaustive resistance and finishes with an explosive bearish breakdown, green bullish
00:10
HD
Digital financial trading chart with candlestick patterns and data analytics
00:10
HD
Dynamic stock market chart with candlestick patterns and real-time financial data on a digital screen ideal for illustrating investment trading and economic analysis
00:08
HD
financial stock market trading chart with candlestick patterns and upward trend analysis for investment data
00:07
HD
Financial stock market chart showing a strong bullish uptrend with green candlestick patterns on a dark digital interface
00:12
HD
Stock market trading chart with candlestick patterns and trend lines on dark background. 4K. 2D Animation. Flat Animation. Seamless Loop.
00:10
HD
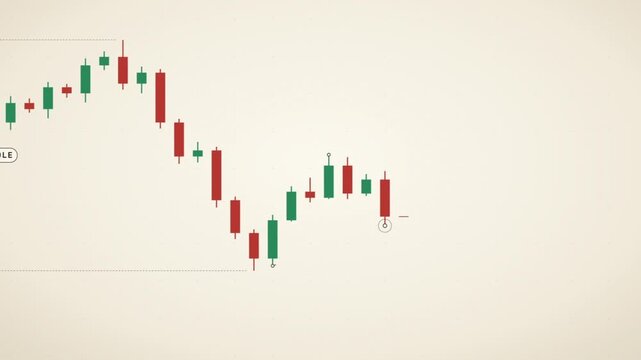
Bear flag pattern explained on candlestick chart with labeled flagpole, flag, breakdown and target on beige
00:16
HD
Financial trading chart showing bearish candlestick pattern
00:10
HD
Stock market financial charts displaying candlestick data patterns
00:05
HD
Digital financial trading chart with candlestick patterns and trend lines on a dark blue background
00:10
HD
financial trading chart displaying candlestick patterns and moving averages on screen
00:10
HD
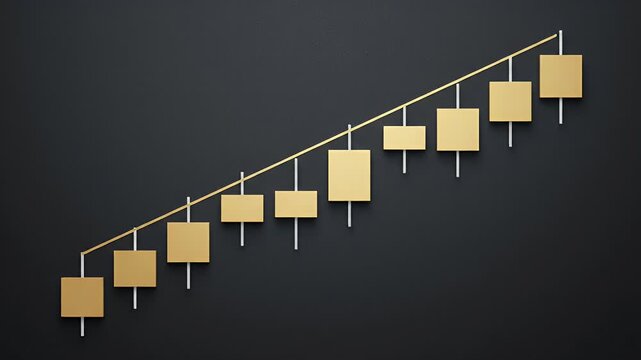
Golden candlestick bar floating with technical line chart, gold trading investment strategy, bullrish commodities market price trend graph, uptrend financial economic growth profit 3d rendering
00:18
HD
Abstract Digital Financial Trading Chart with Candlestick Patterns and Data Visualization on Dark Purple Background
00:20
HD
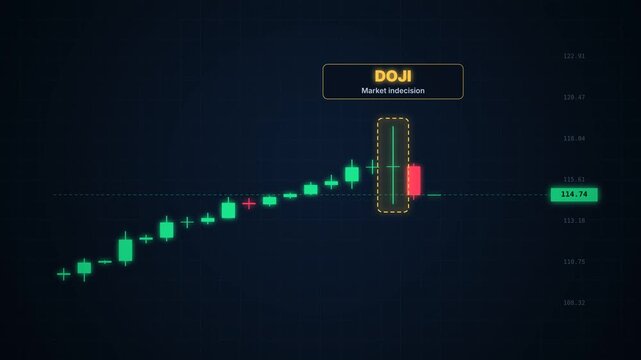
Doji candlestick pattern forming after uptrend, market indecision and trend reversal
00:08
HD
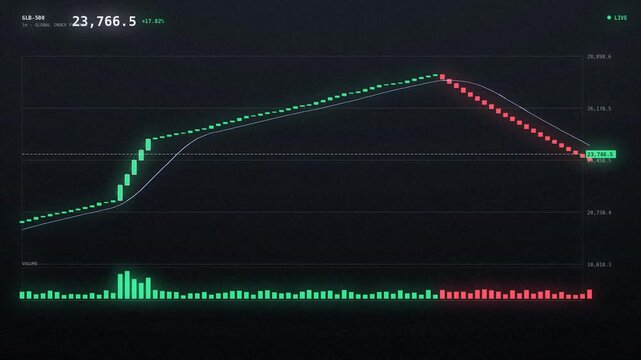
Financial stock chart displaying candlestick patterns with upward trendline and volume indicators on a dark-themed background.
00:05
HD
Financial market chart with candlesticks and line graph, Abstract financial chart with candlestick bars and line graphs market analysis growth and data trends animation
00:10
HD
Dynamic Financial Data Visualization in a Modern Dark Room with Glowing Abstract Charts and Candlestick Patterns Representing Stock Market Trends and Investment Analysis for a Digital Future
00:05
HD
Traders monitor the volatile fluctuations of financial markets by observing shifting candlestick patterns displayed on a digital screen to assess global economic performance during active
00:15
HD
Stock Market Chart Showing Support Bounce and Price Rebound
00:12
HD
Mastering Candlestick Patterns: The Ultimate Guide to Trading Success
00:11
HD
Abstract financial chart with bullish candlestick patterns on white digital background.
00:15
HD
 XAUUSD Chart Line Art Animated Icons Pack, Gold Forex Candlestick Bullion Breakout Technical Analysis, 4K Alpha Loopable
00:12
HD
Stock market chart with candlestick patterns and trend lines illustration
00:06
HD
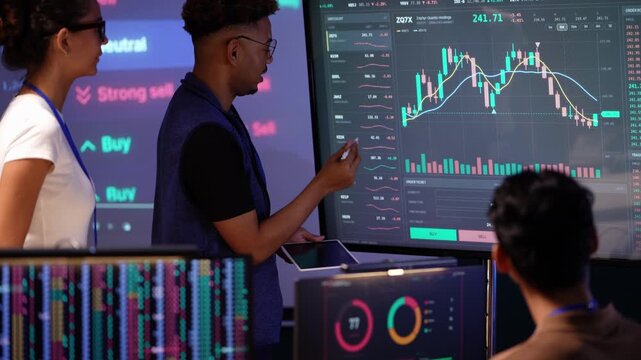
Black analyst in a blue vest gestures at an upward candlestick pattern, then writes on a tablet and speaks while a Latina colleague listens and an Asian man looks on
00:19
HD
Financial trading chart with candlestick patterns and wave lines moving across a red background
00:06
HD
4K Ultra HD Financial trading chart with candlestick patterns and data analytics on a digital screen in a modern office environment video
00:10
HD
This image features an abstract financial chart illustrating market trends with colorful candlestick patterns, highlighting growth and investment opportunities in a corporate setting. Copula
00:10
HD
a digital financial candlestick chart and trendline with cyan and purple and magenta neon bars on a dark background, representing stock market data, price action, or trading volatility
00:05
HD
Financial Trading Charts: Candlestick Patterns, Volume Analysis, and Market Trends on Dark Background
00:15
HD
Minimalist green candlestick chart pattern on a solid black background
00:10
HD
Digital financial candlestick chart displaying market trends, stock trading analysis, investment data and economic forecast
00:07
HD
Real-Time Financial Candlestick Chart Animation for Trading Platform UI
00:14
HD
Digital Financial Trading Chart with Red and Green Candlestick Patterns on Dark Blue Background
00:10
HD
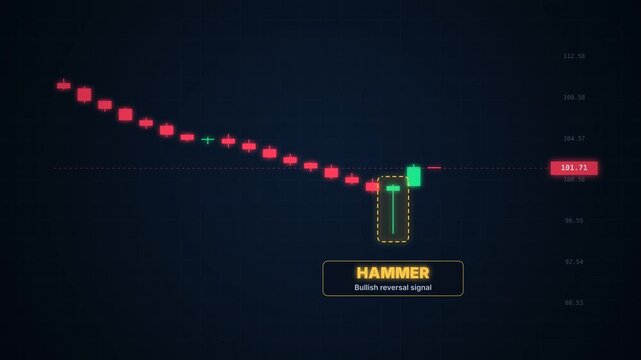
Hammer candlestick pattern forming at bottom of downtrend, bullish reversal signal
00:08
HD
Thin lines tracing curved paths starting central brain shape linking charts showing data growth
00:12
HD
Financial market chart with candlesticks and line graph, Abstract financial chart with candlestick bars and line graphs market analysis growth and data trends animation
00:10
HD
Abstract red stock market candlestick patterns moving downwards across a dark digital screen
00:07
HD
Abstract finance chart showing various candlestick patterns and a smooth moving average line.

00:15
HD
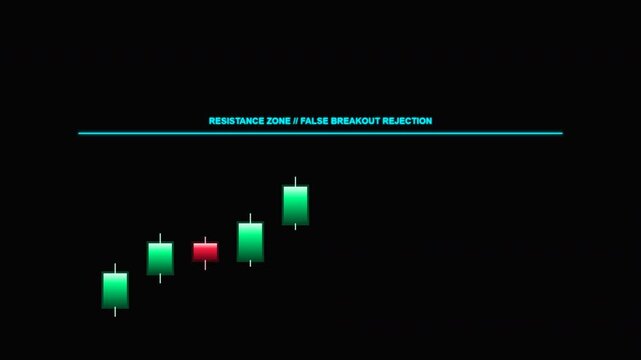
Candlestick Chart Showing Resistance Zone and False Breakout Rejection
00:12
HD
Colorful candlestick chart showing upward trend in financial market analysis
00:10
HD
Abstract financial trading chart with glowing candlestick patterns on dark background
00:08
HD
Animated Stock Market Candlestick Chart Sequence
00:15
HD
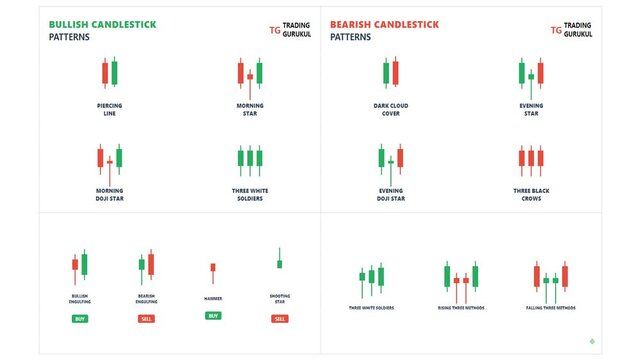
Educational Infographic Animation of Bullish and Bearish Candlestick Patterns for Stock Market Trading Technical Analysis and Financial Data Visualization
00:09
HD
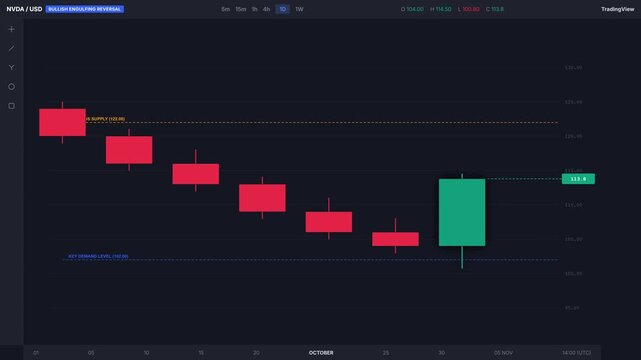
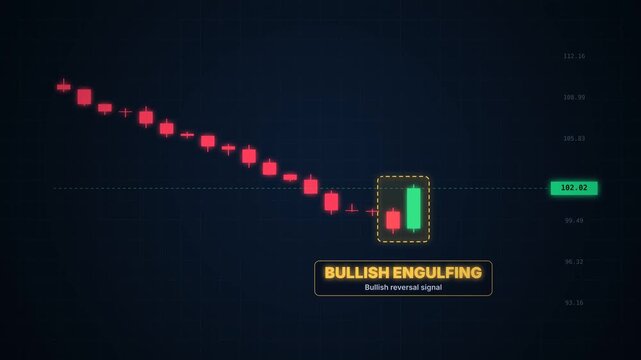
Bullish Engulfing Candlestick Reversal at Support Level 4K Stock Market Animation
00:05
HD
Financial Stock Market Data Chart with Candlestick Pattern and Volatility Analysis Background
00:12
HD
Stock market trading chart with candlestick patterns and financial data analysis background
00:05
HD
Animated colourful candlestick chart pattern graph with rotating globe infographic dashboard showing word economy modern design business stock market backrground
00:16
HD
Financial trading candlestick charts showing price action on black
00:08
HD
Digital Financial Market Analysis Dashboard Featuring Oscillating Candlestick Patterns for Automated Trading Data Visualization
00:15
HD
Stock market price chart with candlestick patterns and trend lines
00:10
HD
Financial stock market chart with glowing trend lines, candlestick patterns, and data analysis elements
00:07
HD
Capturing the dynamic movement of stock market trends, this video showcases vibrant charts with colorful candlestick patterns, ideal for illustrating financial data analysis tools.
00:10
HD
Abstract Digital Financial Trading Chart with Glowing Candlestick Patterns on Dark Futuristic Background
00:20
HD
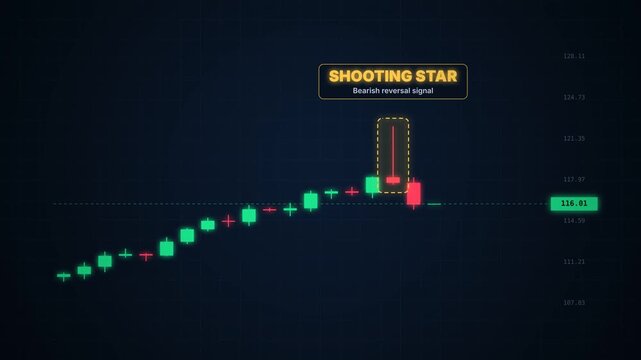
Shooting star candlestick pattern forming at top of uptrend, bearish reversal signal
00:08
HD
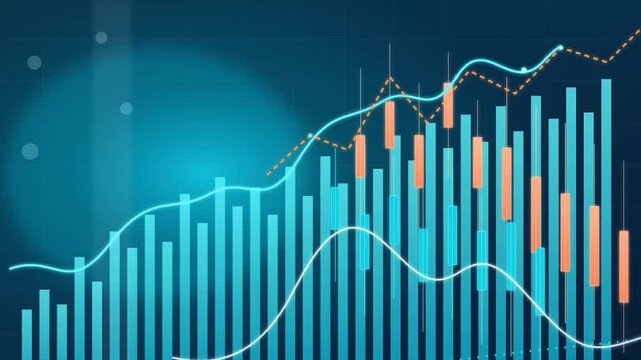
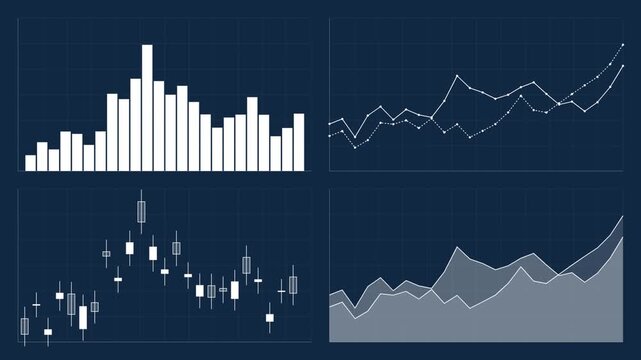
Stylized financial chart with candlesticks animation, bar graphs and line plot on black background
00:12
HD
Financial market chart with candlesticks and line graph, Abstract financial chart with candlestick bars and line graphs market analysis growth and data trends animation
00:10
HD
Financial trading chart with bearish candlestick patterns
00:10
HD
A dynamic stock market chart visualizes financial data with candlestick patterns and glowing orange lights. ..Created with Generative AI, not depicting real subjects.
00:10
HD
Candlestick Trading Pattern Showing Price Movement Through Resistance
00:12
HD
A financial graph shows market trends with blue and green lines. The candlestick patterns vary in height and color, representing different market movements.
00:10
HD
Colorful candlestick chart with vertical bars in dark background
00:12
HD
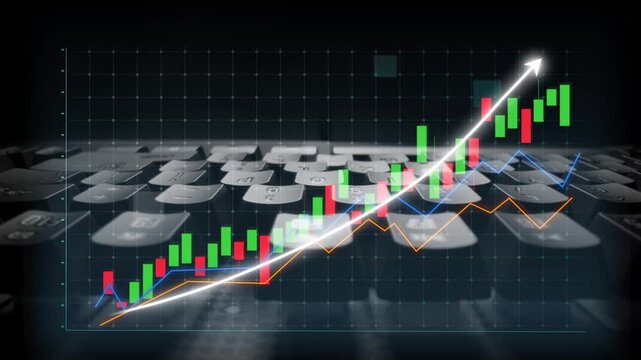
Capture the essence of financial growth with a colorful candlestick graph overlaying a laptop keyboard, representing the dynamic nature of stock markets and investment trends. Copula
00:10
HD
Financial Stock Market Candlestick Chart Animation
00:15
HD
Stock market data visualization showing green rising and red falling line graphs representing financial fluctuations on digital interface screen with candlestick chart patterns
00:08
HD
Animated trading chart with dynamic candlestick patterns. Stock exchange data visualization with price volatility. Financial market analysis in motion. 4K motion graphics.
00:15
HD
Stock market candlestick pattern hammer
00:10
HD
Global Financial Network World Map Candlestick Charts Trading Connections
00:05
HD
Abstract financial chart with candlestick patterns and moving averages on a dark background.
00:15
HD
Candlestick Chart Rising and Falling on Dark Background - Stock Market Trading Animation
00:10
HD
Back View of Dark Robotic Figure Monitoring Real Time Stock Exchange Graphs and Financial Market Trends on Computer Screen. Algorithmic Trading, Robo Advisor, Fintech Analytics, Automated Investment.
00:14
HD
Neon Yellow Candlestick Pattern Stock Chart with Numbers Loop 4K
00:13
HD
Premium 3D neon glassmorphism animation of five floating transparent turquoise financial dashboards with animated ascending candlestick charts, market indicators, and glowing cyan borders on dark char
00:08
HD
Abstract Digital Financial Stock Market Chart with Candlestick Patterns and Glowing Data Visualization Elements
00:20
HD
Bullish engulfing candlestick pattern forming after downtrend, bullish reversal signal
00:08
HD
A glowing neon green graphic of a hammer candlestick pattern against a dark background.
00:10
HD
Abstract financial trading chart with candlestick patterns and glowing trend lines, representing market analysis, stock exchange data, and digital investment growth visualization
00:10
HD
Financial stock market chart showing growth with candlestick patterns animated against glowing neon background
00:14
HD
Showcasing green and red candlestick market patterns for finance data, technical trading, and investment symbols. Suitable for financial presentations.
00:10
HD
Technical Analysis Chart Showing Price Compression Before a Bearish Breakout
00:12
HD
Head and shoulders pattern forming on candlestick chart, neckline breakdown and zoom out on white
00:16
HD
Visualizing Financial Growth: This Video Showcases a Dynamic Stock Market Chart, Highlighting Ascending Trends with Green Candlestick Patterns Against a Dark Background.
00:08
HD
This image illustrates a financial chart with colorful candlestick patterns layered over a keyboard, representing digital trading and investment evaluations vividly. Copula
00:10
HD
Digital stock market chart showing fluctuating green and red candlestick patterns on a dark blue background to represent financial trading trends and volatility for global investment analysis.
00:10
HD
Stock Market Candlestick Chart Transition Rising and Wiping with Included Alpha Matte
00:10
HD
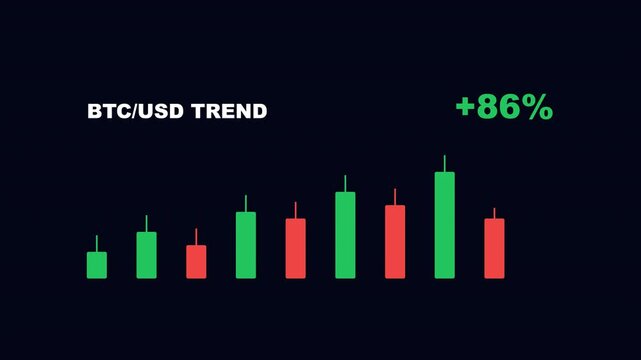
Cryptocurrency candlestick trading chart with positive trend counter overlay
00:07
HD
Financial market data dashboard: animated stock charts, candlestick patterns, and growth trends for business analysis and economic reporting
00:10
HD
Abstract minimalist financial candlestick chart pattern forming upward trend on dark textured background, representing growth and investment
00:06
HD
Financial stock market chart with moving candlestick patterns on a dark blue digital interface.
00:10
HD
Dynamic candlestick stock chart with red blue bars trend line overlay on glowing dark grid background
00:10
HD
An upward trend candlestick chart pattern motion graphic.
00:08
HD
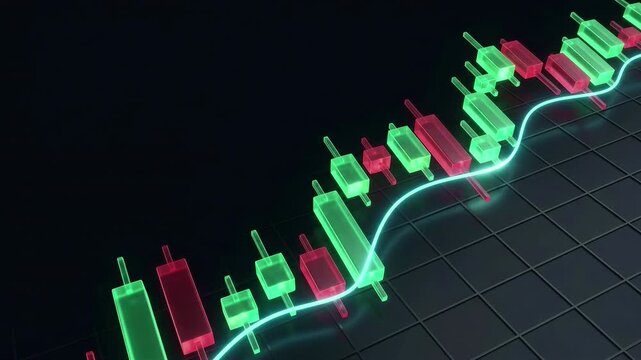
3D glass candlestick chart with glowing moving average trend line rising on dark grid floor. Stock market trading, cryptocurrency analysis, Forex exchange, and fintech finance concept.
00:06
HD