Ein Link zum Festlegen deines Kennworts wurde gesendet an: Um in Zukunft auf deine Käufe zugreifen zu können, benötigst du ein Kennwort.
Erhalte 3 Videos oder 25 Bilder mit einer kostenlosen Testversion.
Neue Filter hinzugefügt
Sortieren nach

44 052 Ergebnisse für chart patterns in „Videos“

Minimalist financial candlestick chart pattern isolated on a black background
00:10
HD
candlestick wall street stock market chart digital economic trends on computer monitor for business concept Generative AI
00:08
HD
Financial market chart with candlesticks and line graph, Abstract financial chart with candlestick bars and line graphs market analysis growth and data trends animation
00:10
HD
Health heartbeat line showing heart rhythm and medical monitor trace animation
00:12
HD
Business people, computer screen and stock market with men, charts and explain trading pattern with data analytics. Back, finance or teamwork with pc, graphs or help for investment, advice or economy
00:05
HD
This image represents an innovative blend of human and robotic interaction within the finance sector, showcasing market growth through a digital financial chart. Copula
00:10
HD
Business Statistics, Market Data And Infographics Layout 4k animation design business market data analysis reports, with infographics, bar stats, charts and diagrams
00:18
HD
4K Ultra HD Financial trading chart with candlestick patterns and data analytics on a digital screen in a modern office environment video
00:10
HD
Financial data growth and rising curve chart
00:10
HD
Big Data Analytics Abstract Visualization
00:25
HD
Stock market chart with candlestick patterns and trend lines illustration
00:06
HD
Business growth concept in allusive graph chart showing marketing sales profit increasing to target . Excellent financial status of corporate business rise up.4k animation video graph
00:10
HD
Abstract finance chart showing various candlestick patterns and a smooth moving average line.
00:15
HD
Stock market trading chart with candlestick patterns and financial data analysis background
00:05
HD
Dynamic stock market chart with candlestick patterns and real-time financial data on a digital screen ideal for illustrating investment trading and economic analysis
00:08
HD
Overhead Aerial View Of A City Intersection With Futuristic Technology. Augmented Reality and Financial Interfaces Highlight Traffic Patterns And Connections, Integrating Social Media And Data.
00:15
HD
Stock market chart with green and red candlestick patterns showing buy and sell signals, financial data analysis, trading strategy, investment graph, digital screen display, economic growth trend
00:08
HD
Ocean topographic map with depth markings, dark blue background
00:30
HD
Digital stock market chart showing fluctuating green and red candlestick patterns on a dark blue background to represent financial trading trends and volatility for global investment analysis.
00:10
HD
Close-up of a stock market graph with red and green candlestick charts on a dark grid background with a cinematic lighting effect conveying a sense of financial analysis and trading
00:05
HD
Professional trader analyzing bearish market trend on multiple monitors displaying falling stock indices candlestick patterns and volume indicators in modern trading floor in  Photo Stock  Concept  an
00:10
HD
3D render: Abstract digital financial data charts background. Futuristic business analytics, market research, global network concept. Big data report, statistic visualization. Ideal for tech
00:20
HD
graph of crypto currency online. stock exchange market chart on computer screen. candlestick pattern
00:20
HD
Focused analyst watching digital trading charts reflected in glasses with vivid blue and red market indicators creating an intense financial scene
00:10
HD
Meeting, planning and above of business people for design, pattern and color for advertising agency. Creative company, teamwork and workers with documents for charts, collaboration and branding
00:05
HD
Abstract background with rising arrows and square patterns, symbolizing growth progress success and business increase animation
00:20
HD
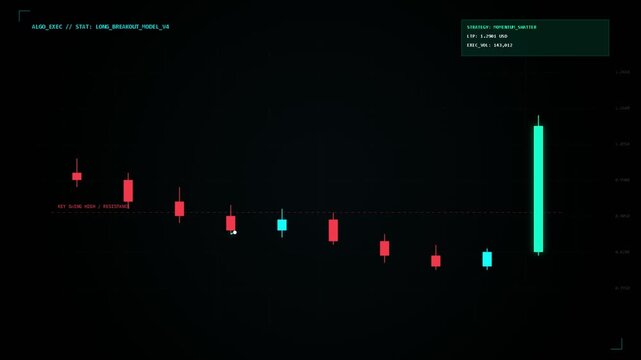
Financial stock market chart showing a strong bullish uptrend with green candlestick patterns on a dark digital interface
00:12
HD
Abstract topographic contour map concept, cartography geographic terrain pattern design, topo wavy black and white mountain surface, liquid line art background animation
00:30
HD
Abstract financial chart with green candlestick patterns and glowing elements against a dark background
00:10
HD
Stock market chart with red and green candlestick patterns showing financial data trends and market fluctuations digital display, conveying dynamic investment activity and analysis, market trend
00:10
HD
Animation of multiple graphs with changing numbers over grid pattern against white background
00:15
HD
This video presents dynamic graphs and charts illustrating market trends and financial data. The colorful lines and moving patterns represent the fluctuating nature of stock markets and investments, p
00:09
HD
Bull flag chart pattern formation showing breakout phases
00:08
HD
Futuristic moving lines animation. concept of advertisement glowing wave lights line with moving animation on green screen background. 4k.
00:13
HD
Business chart graphics and bar stats appearing. Animation of financial infographics diagram showing increasing business growth and success. Digital business trend.
00:20
HD
Looped animation. Looped animation. Abstract background. Moving through hyperspace with bright circles in blue color. Modern colorful wallpaper. 3d rendering.
00:20
HD
Stock market chart with candlestick pattern and moving average lines showing financial data trends and analysis for investment decisions including blue line orange line green candle red candle graph
00:08
HD
Dynamic green financial chart with rising candlesticks glowing grid, and fluctuating lines climbing
00:08
HD
Candlestick chart showing a bearish trend with red and green candles on a black background, representing stock market or financial data analysis
00:09
HD
Please stand by tv test pattern retro vintage broadcast. 4k animation video
00:10
HD
Analysis of financial tables and business statistics
00:15
HD
Please stand by text Vintage TV test screen with retro design and text "PLEASE STAND BY," featuring faded colors and geometric patterns for a nostalgic broadcast effect.
00:06
HD
An AI anomaly detection dashboard visualizes unusual application latency and error patterns with dynamic charts and metrics in a sleek, high-tech style.
00:15
HD
Stock market price chart with candlestick patterns and trend lines
00:10
HD
financial stock market trading chart with candlestick patterns and upward trend analysis for investment data
00:07
HD
Bear flag pattern explained on candlestick chart with labeled flagpole, flag, breakdown and target on beige
00:16
HD
Vertical black graph paper motion video background, looping video set,  Animated grid lines moving from bottom to top in 4k background video, Purple moving grid animation on black background 4K.
00:14
HD
Abstract topographic contour map concept, cartography geographic terrain pattern design, topo wavy black and white mountain surface, liquid line art background animation
00:30
HD
Engagement with digital charts unfolds as hands interact with a tablet, analyzing data visualizations and marking key insights. A thoughtful examination of trends and patterns evolves.
00:06
HD
Technical analysts marking technical bearish signal on chart by drawing descending trendline below consecutive lower highs and confirming with MACD crossover indicator in  Photo Stock  Concept  and em
00:10
HD
Business team analyzing digital data trends and statistics with interactive charts and global map visualization in a modern office environment Gluon.
00:15
HD
Display of complex sentiment analytics data featuring animated wave patterns and vertical bar charts flickering in various neon colors on a dark monitor screen interface
00:06
HD
Percentage 100 percent pie chart progress bar loading symbol circle.
00:10
HD
Abstract financial trading background with purple candlestick chart patterns and neon glowing effects.
00:10
HD
Computer screen, data or team with trading advice for stocks news, chart patterns or office. Trader dashboard, back of people or monitoring graphs for market conditions, statistics or price movement
00:05
HD
Repeating blue print millimeter paper pattern with fine grid lines, technical architecture backdrop, engineering chart surface, planning texture, drafting animation for creative projects
00:10
HD
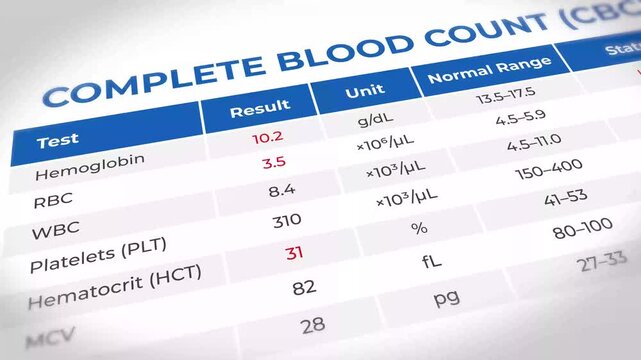
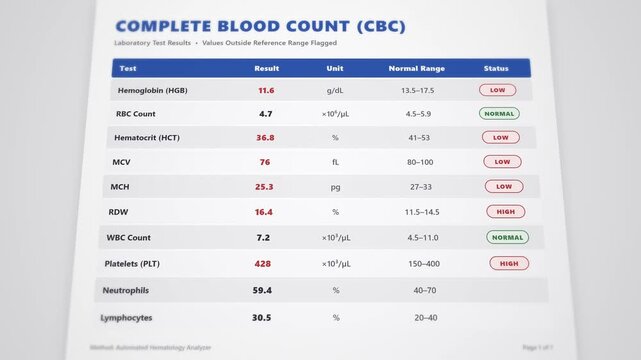
Close-up view of a complete blood count test report showing various blood test results and their normal ranges on a medical chart.
00:10
HD
Futuristic data visualization dashboard displaying various charts and graphs on a digital interface with a modern aesthetic
00:05
HD
Holographic market analytics dashboard with fluctuating statistics. Digital interface showing financial growth patterns.
00:05
HD
Thin lines tracing curved paths starting central brain shape linking charts showing data growth
00:12
HD
A neon stream commerce graphic interface displaying shifting frequency wave patterns and oscillating bar charts within a dark digital environment designed for monitoring complex network flow activity
00:06
HD
Abstract financial trading chart with candlestick and line graph motion graphics
00:05
HD
Animation of blue squares with white markers over grid background
00:10
HD
Stock market chart shows data trends over time with bars indicating price movements in trading activity.
00:10
HD
Digital recovery analytics display showing fluctuating heartbeat patterns and monitoring vital signs on a dark neon interface screen with multiple shifting charts for medical monitoring processes
00:06
HD
Interactive detailed complete blood count laboratory report template: animated mixed test results with abnormal values flagged among normal indicators
00:08
HD
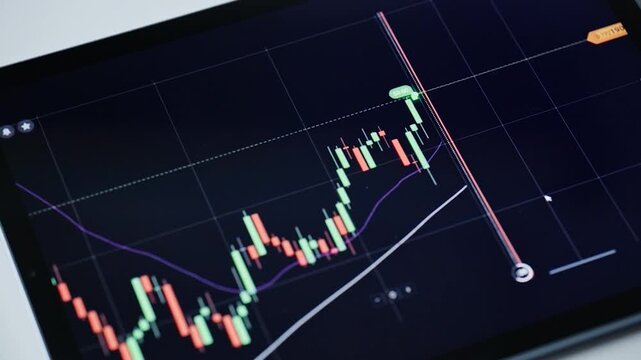
Closeup of a digital tablet displaying a financial stock market trading chart with candlestick patterns and technical analysis indicators
00:12
HD
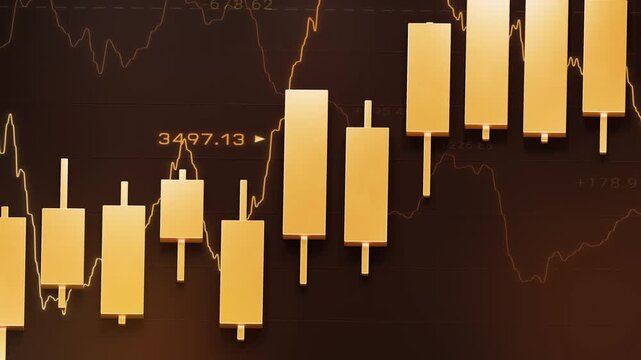
Golden candlestick bar floating with technical line chart, gold trading investment strategy, bullrish commodities market price trend graph, uptrend financial economic growth profit 3d rendering
00:18
HD
Financial trading chart showing bearish candlestick pattern
00:10
HD
animated Grid pattern moving vertically downward seamless loop animation black background Video
00:15
HD
This image features an abstract financial chart illustrating market trends with colorful candlestick patterns, highlighting growth and investment opportunities in a corporate setting. Copula
00:10
HD
Digital playback analysis interface displays rhythmic bar charts and circular progress indicators with glowing neon light patterns on a dark blue screen for monitoring system performance metrics
00:06
HD
Glowing red stock chart line descending in stair step pattern showing market decline
00:12
HD
Digital financial trading chart with candlestick patterns and trend lines on a dark blue background
00:10
HD
Abstract financial chart with glowing digital candlestick data points moving across dark screen representing stock market volatility investment analysis business growth and economic trends.
00:10
HD
digital graph paper grid chart subtle dark blue background with military, science, technology, or medical theme backdrop animated wallpaper 4K
01:00
HD
Glowing financial chart with neon lines in digital style on dark background, concept of data analysis and market trends
00:10
HD
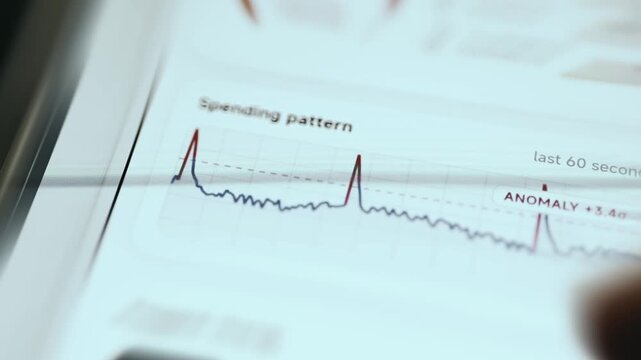
Spending pattern for the last 60 seconds showing a red trend line with spikes
00:11
HD
Glowing bar chart with ascending red line graph during dark digital background with subtle grid pattern
00:05
HD
A developer observes AI-driven code generation on a computer screen as the artificial intelligence model autonomously creates software algorithms, exemplifying automation in programming
00:13
HD
Portfolio analysts documenting market in decline via time?series heatmap and area chart overlays to communicate drawdown patterns in  Photo Stock  Concept  and empty space on the left side
00:10
HD
Abstract financial chart with bullish candlestick patterns on white digital background.
00:15
HD
Glowing neon business graph arrow illustrates saw pattern animation. Rising neon colored line graph showing upward trend in stock market. business chart growth concept black background..
00:06
HD
Financial market trends are shown using colorful lines and bars on a dark background with visible data points.
00:10
HD
A digital recovery analytics dashboard display features glowing neon wave graphs oscillating patterns and vertical bar charts flickering across a dark screen during a computer simulation
00:06
HD
Modern financial data visualization with trend lines and bar charts
00:10
HD
Colorful financial candlestick chart with blue, yellow, and red bars showing market trends and data analysis dark background, colorful candlestick chart financial data stock market trading graph
00:10
HD
Glowing blue line chart outperform target revenue, growth earning business report concept, uptrend neon technology style graph raising profits market success, investment commodity prices animation
00:06
HD
Financial chart stock market trading candlestick data analysis investment graph price volatility dynamic movement forex technology screen data driven pattern insight market cycle trend line breakout
00:08
HD
Loop Abstract Data Trading Chart Visualization
00:15
HD
Abstract digital technology background with glowing blue data charts and hud interface elements
00:15
HD
Abstract financial chart with uptrend line, stock market data analysis and investment.
00:07
HD
Digital candlestick financial chart displaying market trend fluctuations
00:05
HD
Abstract financial trading chart with candlestick patterns and trend lines on a dark blue digital background
00:10
HD
Explore the intricacies of stock market dynamics with a digital chart showcasing growth trends, perfect for financial analysis, investment strategy, and data-driven decisions. Copula
00:10
HD
Algorithmic trading interface displaying complex financial candlestick patterns and neon wave oscillation charts on a dark digital screen to visualize real time market price volatility fluctuations
00:06
HD
Technical analysis of a double top pattern on financial candlestick chart. Bearish reversal formation indicating a potential short trade at stock and crypto market. Short indicator.
00:21
HD
Complex catastrophe mapping software displays dynamic fire front movement metrics across simulated digital topography with oscillating waveform patterns and evolving burn severity bar charts on screen
00:06
HD
Abstract background featuring multiple overlapping sine wave patterns on a dark background.
00:20
HD
Analyzing financial data charts with candlestick patterns and time indicators
00:12
HD