An illustration comparing different types of data representation: a standard box plot (orange), bars and whiskers (green), violin plot (blue) and scatter ...
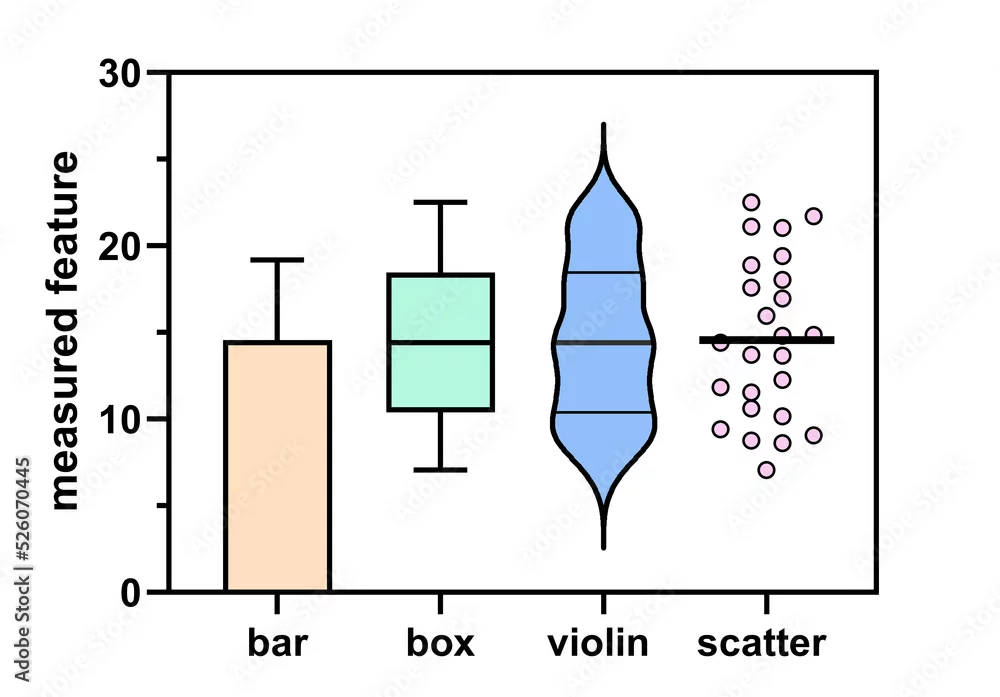
An illustration comparing different types of data representation: a standard box plot (orange), bars and whiskers (green), violin plot (blue) and scatter plot (purple).