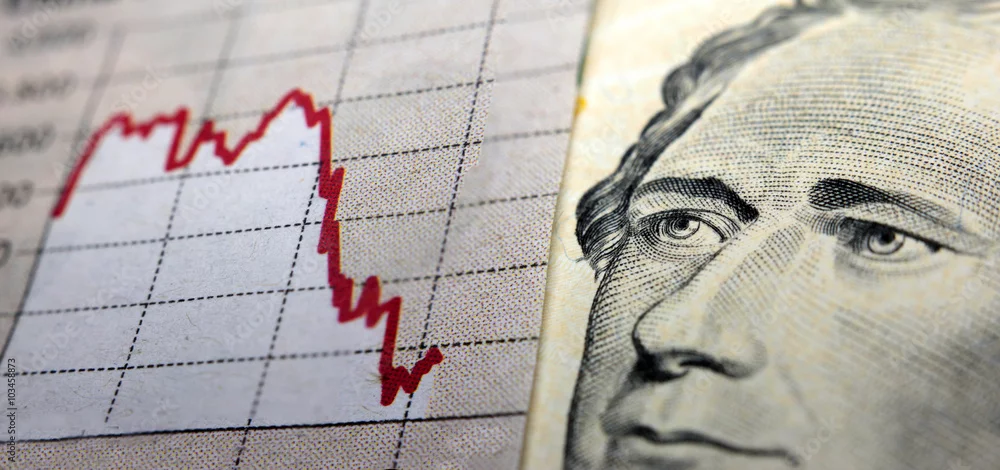
Stock Market Graph next to a 10 dollar bill (showing former president Hamilton). Red trend line indicates the stock market recession period
Stock Market Graph next to a 10 dollar bill (showing former president Hamilton). Red trend line indicates the stock market recession period
de corlaffra
DIMENSIONES
7449 x 3500 px
TIPO DE ARCHIVO
JPEG