A digital bar chart with a white dotted line graph overlay, showcasing data from 2021 to 2026. The multi-colored bars (blue, orange, red, cyan, yellow, ...
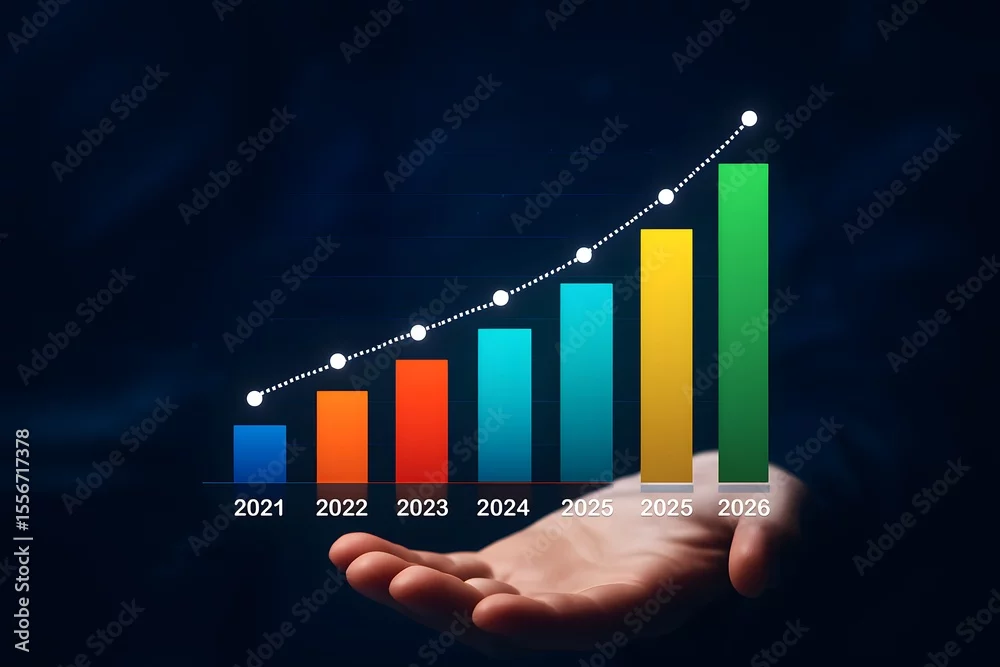
A digital bar chart with a white dotted line graph overlay, showcasing data from 2021 to 2026. The multi-colored bars (blue, orange, red, cyan, yellow, green) represent growth and progress. The chart
by Lapak
Generated with AI
Editorial use must not be misleading or deceptive.